

Operations | Monitoring | ITSM | DevOps | Cloud

The latest News and Information on DevOps, CI/CD, Automation and related technologies.

VPC Log Format: Custom and Advanced Configurations

VPC Flow Logs come with a default format that gives you basic network traffic details. But you can tweak the format to capture exactly what you need. This can lower costs, speed up processing, and make your logs fit better with what you’re trying to monitor. If you want to improve security, keep an eye on performance, or save money, adjusting your VPC logs can make a big difference. Let’s take a look at some practical ways to customize your logs beyond the default settings.

15+ Continuous Deployment Tools To Streamline Your Workflow

In our post, 9 Continuous Delivery Tools For Reliable Releases, we explored why continuous delivery is critical to building robust development pipelines — and how it helps teams deliver customer value while boosting the bottom line. Today, we’re diving into the next evolution of that pipeline: continuous deployment. Today’s technology companies need to release quality features quickly and put them in users’ hands even quicker.

Common Issues with Grafana Login and How to Fix Them

Grafana is a popular choice for monitoring and visualizing metrics, but login issues can quickly block your access and slow you down. Forgot your password? Can’t get into the admin account? Problems after changing authentication settings? These are some of the most common hiccups—and they’re usually easy to fix. This guide covers the frequent login problems you might face and walks you through practical ways to resolve them.

Track the Right Elasticsearch Metrics Without the Noise

Elasticsearch does a lot right—it's fast, scalable, and makes searches feel simple. But when things slow down or break, figuring out what’s going on can be frustrating. Especially if you’re not keeping an eye on the right metrics. This guide covers Elasticsearch metrics that are worth tracking and how they help you keep your cluster healthy without data overload.

OpenTelemetry vs Micrometer: Here's How to Decide

In a distributed system, things break in unexpected ways. That’s why observability isn’t optional—it’s how you understand what’s going on under the hood. If you’re comparing tools to instrument your services, OpenTelemetry and Micrometer are two names you’ll run into. Both are used to collect metrics, but they take very different approaches—especially when it comes to flexibility, vendor support, and what you can do with the data.

Port + Komodor: Bringing Kubernetes Visibility into the Modern Commercial IDP

Internal Developer Portals (IDPs) are no longer just an experimental concept—they’re now a foundational component of modern software delivery. As engineering organizations look to reduce cognitive load, increase self-service, and streamline infrastructure workflows, IDPs have emerged as the most effective way to productize platform engineering.

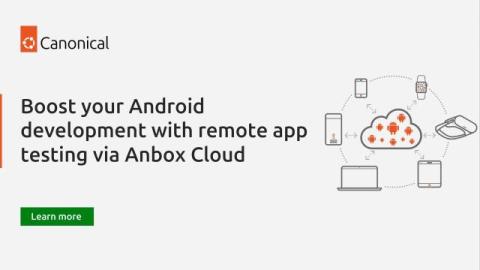
Boost your Android development with remote app testing via Anbox Cloud

In today’s hectic app development cycles, speed is key. But as teams scale and spread worldwide, and app complexity increases, traditional testing workflows become bottlenecks that can compromise security, increase operational costs, and delay product delivery. Simply sharing APKs or configuring physical test devices isn’t enough anymore – it’s time to rethink how we test and demo Android apps.

Monetizing Mobile App Infrastructure: The Rise of APK-Based Affiliate Campaigns

As mobile ecosystems become more fragmented and app stores more regulated, developers and ops teams are turning to performance-driven affiliate models to monetize outside traditional channels. Platforms like CIPIAI now offer streamlined, scalable methods for earning revenue via APK-based affiliate offers, especially in utility and Android-first verticals. When combined with the right infrastructure, these strategies create a new category of mobile DevOps monetization.

.NET Logging with Serilog and OpenTelemetry

Debugging modern.NET apps isn’t as simple as scanning logs anymore. With services spread out and systems growing more complex, it's easy to miss the bigger picture. Serilog gives you clean, structured logs. OpenTelemetry brings in traces and metrics to connect the dots. This guide covers how to wire up Serilog with OpenTelemetry, send logs to traces, and build an observability setup that helps you troubleshoot, without digging through disconnected logs for hours.