Operations | Monitoring | ITSM | DevOps | Cloud

The latest News and Information on Distributed Tracing and related technologies.

Metrics, Logs and Traces: More Similar Than They Appear?

This article was originally published in The New Stack and is reposted here with permission. They require different approaches for storage and querying, making it a challenge to use a single solution. But InfluxDB is working to consolidate them into one. Time series data has unique characteristics that distinguish it from other types of data. But even within the scope of time series data, there are different types of data that require different workloads.
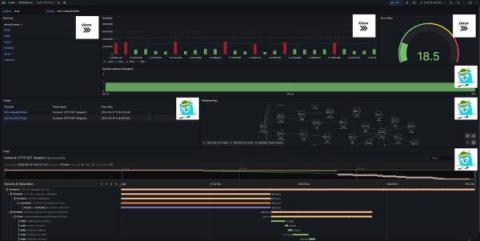

OpenTelemetry Tutorial: Collect Traces, Logs & Metrics with InfluxDB 3.0, Jaeger & Grafana

Here at InfluxData, we recently announced InfluxDB 3.0, which expands the number of use cases that are feasible with InfluxDB. One of the primary benefits of the new storage engine that powers InfluxDB 3.0 is its ability to store traces, metrics, events, and logs in a single database. Each of these types of time series data has unique workloads, which leaves some unanswered questions. For example: Luckily this is where our work within OpenTelemetry comes into play.

Monitor OTel-instrumented apps with support for W3C Trace Context

To get visibility into highly distributed applications, organizations often use various tracing tools that are best suited to each individual service owner’s specifications. However, when a request travels between services that have been instrumented with different tools, the trace data may be formatted differently, resulting in broken traces.

Deciphering Complex Logs With Regex Using BindPlane OP and OpenTelemetry

Parsing logs with regex is a valuable technique for extracting essential information from large volumes of log data. By employing this method, one can effectively identify patterns, errors, and other key insights, ultimately streamlining log analysis and enhancing system performance.

Reducing Log Volume with Log-based Metrics

As the amount of telemetry being collected continues to grow exponentially, businesses are continuously seeking cost-effective ways to monitor and analyze their systems. Data collection and monitoring can be expensive, especially when dealing with large volumes of logs. One approach to maintaining visibility while reducing the amount of data collected is through creating log-based metrics.

Coralogix Deep Dive - Tracking Every Interaction with Tracing and APM

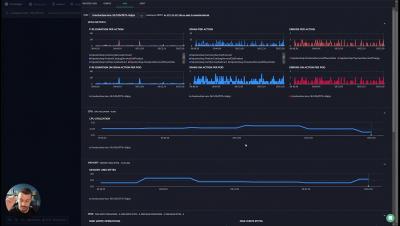
Coralogix Tracing and APM functionality offers a unique troubleshooting experience, with rich information density, without the need to context switch, with native support for Serverless, Kubernetes, EC2 and many other services, as well as an elegant, living architecture diagram that gives instant visibility to even the most complex components of your system.

Before Taking the Plunge, Dip Your Toes in OTel

OpenTelemetry was launched in May 2019, as a merger of the OpenCensus and OpenTracing projects. The open-source, vendor-neutral project resides within the Cloud Native Computing Foundation (CNCF), which virtually ensures its longevity and widespread adoption. In fact, OpenTelemetry has gained significant traction in recent years, with support from many major cloud providers and the tech industry.