Operations | Monitoring | ITSM | DevOps | Cloud

The latest News and Information on Distributed Tracing and related technologies.

Modern observability and security on Kubernetes with Elastic and OpenTelemetry

The structured nature of Kubernetes enables a repeatable and scalable means of deploying and managing services and applications. This has led to widespread adoption across market verticals for both on-premises and cloud deployment models. The autonomous nature of Kubernetes operation, however, demands comprehensive, fully-converged observability and security. This is uniquely possible today using the Elastic platform.

How OpenTelemetry Powers Observability @ Canva

Canva is an online design platform with a mission to empower everyone in the world to design anything and publish anywhere. To guarantee our customers have the best experience using our products, Canva engineers rely on the tools and products provided by the Observability team to measure and quantify critical application health and performance metrics. Canva’s Observability team uses OpenTelemetry components to collect, transform and export standardised telemetry data from our applications and platforms. Canva has been an early adopter of OTel using OTel SDK for tracing and the collector gateway to process and export telemetry to various tools.

Auto-Instrument Your Apps Using the OpenTelemetry Operator

Instrumenting your apps to emit traces make them highly observable. Before the OpenTelemetry Operator for Kubernetes, we achieved quasi-auto instrumentation by pulling in client libraries for our specific programming languages into our code. This webinar will demonstrate how the OpenTelemetry Operator enables auto-instrumentation of the app - without manually changing the code!

A Simplified Guide to OpenTelemetry

Digital services are increasingly built as a collection of components working in concert to deliver significant business functions. Understanding how these components of a system are working is crucial to reliably delivering a service. With many systems interacting, it can be difficult, if not impossible, to understand the state of your services and their dependencies without detailed data about how they function.

Tracing with InfluxDB IOx

Tracing has always been a key use case for time series data. But admittedly, it’s also one that past versions of InfluxDB could not handle as well as we wanted. One of the roadblocks was the cardinality issue. Tracing data is, almost by definition, high cardinality data and prior to InfluxDB IOx, high cardinality data could affect query performance.

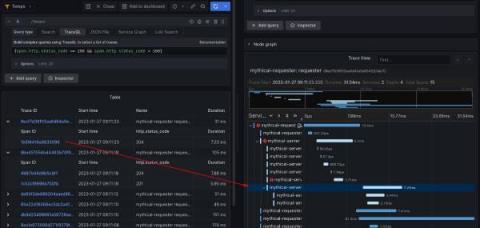
TraceQL: a first-of-its-kind query language to accelerate trace analysis in Tempo 2.0

The much-anticipated release of Grafana Tempo 2.0, which we previewed at ObservabilityCON 2022, will represent a huge step forward for the distributed tracing backend. Among the biggest highlights will be TraceQL, a first-of-its-kind query language that makes it easier than ever to find the exact trace you’re looking for. There’s supposed to be a video here, but for some reason there isn’t. Either we entered the id wrong (oops!), or Vimeo is down.

AppSignal for Node.js 3.0 Introduces OpenTelemetry Support

After a period of beta testing, we're happy to announce the launch of our latest AppSignal for Node.js package. This package features six new integrations and uses the OpenTelemetry framework for reliable telemetry data collection. OpenTelemetry is an open standard that facilitates the instrumentation of standardized telemetry data collection. AppSignal is committed to using OpenTelemetry in new integrations, and our Node.js integration is the first to use the standard.