Operations | Monitoring | ITSM | DevOps | Cloud

The latest News and Information on Observabilty for complex systems and related technologies.

OpenTelemetry for Go: measuring the overhead

Everything comes at a cost — and observability is no exception. When we add metrics, logging, or distributed tracing to our applications, it helps us understand what’s going on with performance and key UX metrics like success rate and latency. But what’s the cost? I’m not talking about the price of observability tools here, I mean the instrumentation overhead.

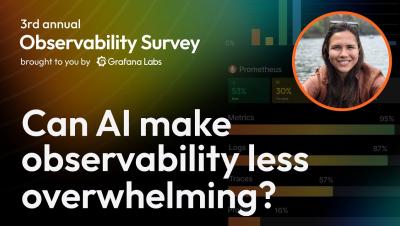
Observability trends in Japan: Insights from Grafana Labs' latest survey

Japanese organizations are focused on controlling costs and limiting complexity—and they might be getting ready to broaden their adoption at just the right time, according to analysis of a micro survey on observability recently conducted by Grafana Labs. Observability is an evolving space in Japan, and this is the first time Grafana Labs has run a Japanese version of our annual Observability Survey.
Sponsored Post

The Network-First Advantage: How Fabrix.ai Redefines Observability from the Ground Up

Modern enterprises today often find themselves in a peculiar predicament: they are drowning in a deluge of telemetry data—including logs, metrics, and traces—yet paradoxically remain blind to what truly matters. Despite making substantial investments in observability tools, teams frequently find themselves reacting to incidents rather than proactively preventing them, with alerts flooding dashboards often devoid of critical context.

Ensure trust across the entire data life cycle with Datadog Data Observability

As data systems grow more complex and data becomes even more business-critical, teams struggle to detect and resolve issues that impact data quality, reliability, and, ultimately, trust. Engineers have to rely on manual checks and ad hoc SQL queries to catch data quality issues—often after teams relying on the data have noticed something has gone wrong.

Lunar-level observability: How Firefly Aerospace used Grafana to monitor its historic moon landing

On March 2, 2025, Firefly Aerospace made history. The company — a space services firm that offers safe, reliable, and economical access to space — completed the first fully successful lunar landing by a commercial provider with its Blue Ghost Mission 1. But behind the headlines and highlight reels was a team of dedicated engineers, years of preparation, and a mission control center outfitted with Grafana dashboards.

Smarter Telemetry Pipelines: The Key to Cutting Datadog Costs and Observability Chaos

Log volume is exploding, costs are rising, and most teams are stuck duct-taping together short-term fixes. During our webinar, "Optimizing Log Management in Datadog: Cut Costs Without Losing Insights," we discuss how DevOps and engineering leaders are navigating the growing pains of observability, especially in environments where tools like Datadog are mission-critical but challenging to manage. Here’s a recap of the key takeaways.

It's The End Of Observability As We Know It (And I Feel Fine)

In a really broad sense, the history of observability tools over the past couple of decades have been about a pretty simple concept: how do we make terabytes of heterogeneous telemetry data comprehensible to human beings? New Relic did this for the Rails revolution, Datadog did it for the rise of AWS, and Honeycomb led the way for OpenTelemetry.

The One Where We Show You Copilot Editor

Copilot Editor is like an AI-powered Rosetta Stone for telemetry. It helps Cribl users take raw, messy telemetry data and turn it into standardized, analytics-ready formats. The most important piece? It puts YOU in control. Our human-in-the-loop design means that users have full control over and visibility into what’s happening with their critical data, preventing AI-induced mistakes. Watch this fun demo with the AI product team to show Copilot Editor's true value to the average Cribl user!