Operations | Monitoring | ITSM | DevOps | Cloud

The latest News and Information on Log Management, Log Analytics and related technologies.

LogDNA | Log Management for the Kubernetes Age

LogDNA is a modern log management solution that empowers DevOps teams with the insights that they need to develop and debug their applications with ease. Users can get up and running in minutes, see logs from any source instantly in Live Tail, and effortlessly search them with natural language. Custom Parsing, Views, and Alerts put users in control of their data every step of the way.

IBM Log Analysis with LogDNA

IBM Log Analysis with LogDNA enables you to quickly find the source of issues and gain deeper insight into application and cloud environment data. Easily aggregate and search application, and server logs within a single platform. Forward logs from IBM Cloud Kubernetes clusters, servers, and applications in as little as three steps. IBM Log Analysis with LogDNA is trusted by teams like IBM Cloud, The Weather Company, and IBM Watson.

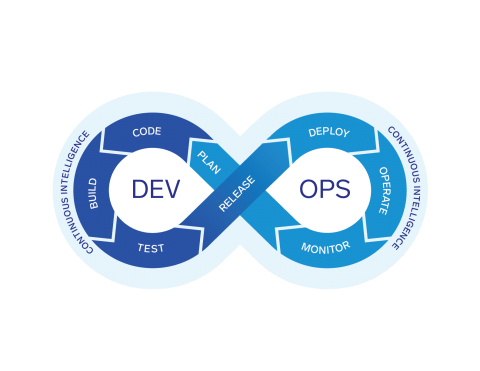
Continuous Intelligence for Atlassian tools and the DevSecOps Lifecycle (Part 1)

Implementing and operationalizing the best practices and capabilities of DevOps into an organization is a key predictor for increased customer satisfaction, organizational productivity and profitability. Doing so successfully can be a challenging endeavour. Implementing DevOps can be particularly difficult because it oftentimes requires technology changes, process changes and a drastic change in mindset.

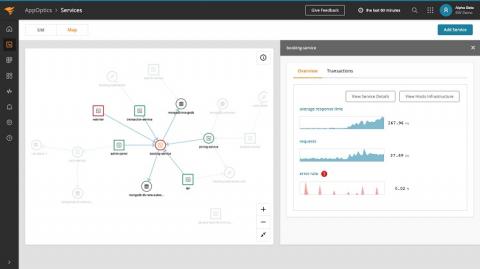
SolarWinds Updates APM Suite Designed to Simplify Application and Infrastructure Management

Introduces new service map and web transaction recorder, enhanced custom parsing rules, and search user experience to further reduce application performance management complexity and speed up troubleshooting.

How to categorize logs for more effective monitoring

Logs provide a wealth of information that is invaluable for use cases like root cause analysis and audits. However, you typically don’t need to view the granular details of every log, particularly in dynamic environments that generate large volumes of them. Instead, it’s generally more useful to perform analytics on your logs in aggregate.

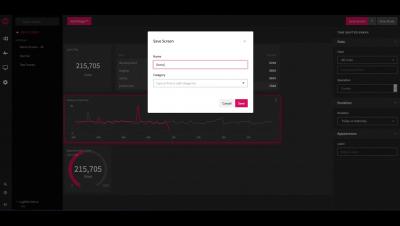
LogDNA | How to Create Screens

The Screens feature displays a series of widgets to share across an organization. Widgets can display log activity, from the number of logs ingested in the last 4 hours, to a line graph comparing today’s to yesterday’s log ingestion. Control the data displayed by customizing a “Screen” with a combination of different widgets, providing your organization with a snapshot of the system’s activity.

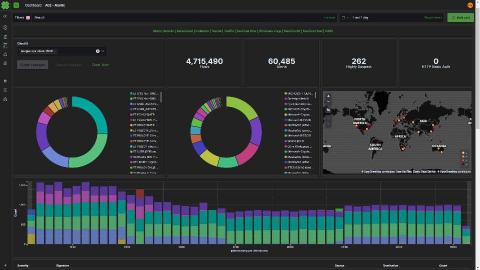
Real-time monitoring of Fastly metrics with the Elastic Stack and Haskell

The Stack Infra team at Elastic uses many services to provide downloads for projects like Elasticsearch and Kibana to our users. One of these services is Fastly, which helps us optimize delivery to regions around the world. Keeping an eye on the performance and behavior of our CDN is important to ensure we're operating at the level we expect.

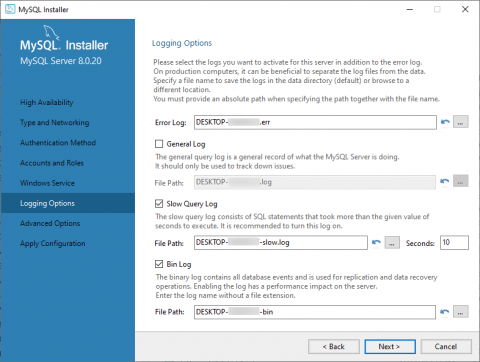
MySQL Log File Location

Logs are valuable. Logs generated by a major backend resource that provides clients with access to crucial data are more than just valuable; knowing where they are and being able to manage and understand the information that they contain can mean the difference between smooth, secure operation and degraded performance or even catastrophic failure for your application. MySQL Server produces a handful of basic logs.