Operations | Monitoring | ITSM | DevOps | Cloud

Agent vs Agentless Monitoring and How to Decide What Goes Where

Why does half the infrastructure end up returning no monitoring data? The standard plan is to install collection software on everything, which moves quickly across servers and stops dead at the first device running closed firmware. Storage arrays, firewalls, and switches will never accept an install, and the rollout stalls there. That plan usually gets set once for the whole environment, with a single collection model applied to hardware it was never suited for.

Help Desk Software for Schools: Managing IT Support Across Campuses

How many support requests reach school IT staff each week without ever becoming a ticket? A teacher stops a technician in the corridor about a projector that will not connect. An office administrator sends a direct email about a locked account, and a student tells the librarian their laptop stopped charging during second period. Help desk software for schools collects those requests into one queue, routes them by site and category, and keeps a record of what was done.

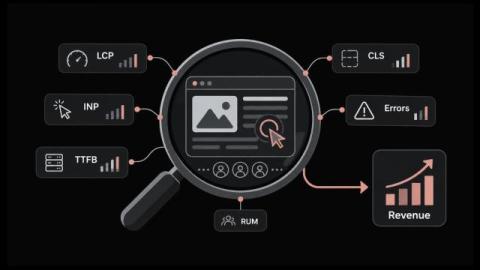
10 Top Website Monitoring Tools for Uptime, Page Speed and Real User Data

Your uptime tool reports the site as available all month. Support reports something else, because customers in one region spent the morning unable to complete a checkout. Both records are accurate, and that is the problem. An external check confirms the page answered. It cannot tell you that the answer took nine seconds for everyone routed through one CDN edge, or what caused the delay.

PII Redaction in Logs: Mask, Redact, Hash, or Drop?

Sensitive values reach your logs without anyone deciding they should. A debug line prints a whole request object. An error message carries the query string. A customer email address is suddenly stored in three systems. PII redaction in logs then gets treated as one setting to switch on. In practice it covers four separate treatments. The value is already inside the message before log ingestion finishes. In this blog, you will: By the end you can write a rule for each field and defend it.

Log Processing: What Happens to a Log Line Before You Can Search It

A log line arrives as plain text and leaves as a record you can query. Six steps sit between those two states. Each one adds something useful, and each one costs you time, CPU, or storage. Most teams never look at that chain until a search comes back empty. Here is what log processing does to an event, step by step: By the end you can look at your own chain. You will know what each step buys you. Six steps turn a raw log line into a searchable record.

How NIST Compliance Turns Observability Data Into Audit Evidence

Can you prove, on demand, which production systems were under continuous monitoring last quarter? Buyers, auditors, and insurers all ask a version of that question, and the answer decides contracts as often as audit findings. NIST compliance means aligning security controls and operations with standards from the National Institute of Standards and Technology, then holding evidence that the alignment stayed continuous. The frameworks are precise about outcomes and quiet about mechanics.

Best Storage Monitoring Software: 10 Tools Compared

Storage rarely fails loudly. A pool fills. Latency climbs on one LUN. The first to notice is a user whose application timed out. The best storage monitoring software catches it earlier. It watches capacity, IOPS, latency and drive health across your arrays, which is what storage resource monitoring is for. In this blog, you will see: By the end you will know which one fits. Storage monitoring software tracks the health, capacity and performance of your IT storage.

What is Network Visibility and How do you Achieve It?

What happens when the segment that failed was never reporting to anything? The incident stops being a diagnosis and turns into a search, and the cost of that search lands on the business rather than on the network team. Network visibility measures how much of your environment can account for itself under pressure. Most teams assume their coverage is broadly complete because their monitoring platform reports thousands of healthy objects.

10 Top Hyper-V Management Tools for Single Hosts, Clusters and Hybrid Infrastructure

An application slows down every month-end. You open Hyper-V Manager, the virtual machine looks healthy, and the ticket closes without a cause. Next month it happens again. Native consoles show live state and keep no history behind it, so nobody can prove whether the fault was the guest, the host, or a storage path shared with nine other workloads. That gap sets what a Hyper-V deployment costs to run, measured in unplanned downtime and in engineering hours spent guessing. This guide covers.

Top 9 AIOps Tools to Cut Alert Noise and Speed Up Root Cause Analysis

During your last major outage, several monitoring tools raised alerts and every one of them was correct. What none of them could say was which alert explained the others, so the opening stretch of the incident went on assembling a picture the systems already held between them. That time shows up in your availability numbers, your SLA credits, and your board report. AIOps platforms close that gap by grouping the alerts caused by the same failure and handing your team one incident with context attached.