
Operations | Monitoring | ITSM | DevOps | Cloud

With a sandbox workspace of its own, Olly answers bigger questions

Ask Olly to audit your alert coverage and it pulls the whole set through the API, works through it with a script, and hands back the gaps as a report you can send to the team. DataPrime and PromQL already answer the questions that fit a query language, and Olly has been answering those for a long time. The sandbox is for everything else: the sources that have no query language of their own, the correlations that span two languages at once, and the analysis that needs a script rather than a filter.
What Is OpenTelemetry? A Guide to the OTel Framework

OpenTelemetry (OTel) is an open-source observability framework, hosted by the Cloud Native Computing Foundation (CNCF), that standardizes how your applications generate, collect, and export telemetry data such as traces, metrics, and logs. The instrumentation stays vendor-neutral, so you can instrument a service once, send its telemetry to the observability tool your team uses today, and point it at a different tool next year without touching application code.

Pushing metric concurrency, cardinality, compute and retention limits with $1000 of infrastructure

We gave five metrics backends the same budget, the same week of data and the same ten queries, then ran those queries at rising concurrency. At one query at a time, the open source engines looked strong. Under concurrency, two of them stopped answering, and the rest slowed down by an order of magnitude.

PCI Compliance Logging: Complete Guide to Requirement 10

Of the 12 Payment Card Industry Data Security Standard (PCI DSS) requirements, Requirement 10 is one your platform team can engineer directly. Under the PCI DSS v4.0.1 standard, automated log review has been a tested requirement since March 31, 2025. Your assessor will test the mechanism that performs the review. This PCI compliance logging guide covers each 10.x sub-requirement, maps the seven event classes to log sources, and lays out a nine-step program you can hand to your assessor.

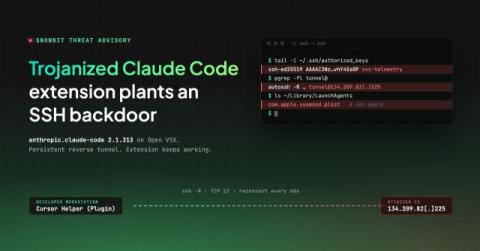
Threat Advisory - Trojanized Claude Code Extension: SSH Backdoor

A tampered build of the Claude Code editor extension (anthropic.claude-code 2.1.313) was published on the Open VSX store used by Vs code,Cursor and similar editors, quietly gives attackers persistent remote access to any computer that runs it, while the extension keeps working normally. Researchers don’t yet know how it was published (the listing belongs to an Anthropic employee) or who is behind it. They found no evidence that Anthropic’s official Marketplace release was affected.

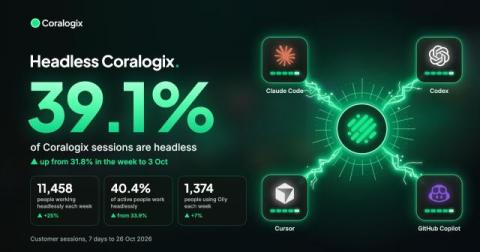
39% of Coralogix sessions are now headless

We set out to understand how customers were using Coralogix from outside the web app. Olly answers questions about a system in plain language. Coding agents query logs, examine traces, read metrics and configure the platform through the Coralogix CLI and MCP server. We wanted to see how much of this was becoming part of everyday work. In the week of 20–26 October, 39% of Coralogix sessions included Olly, the CLI or MCP.

Meet the new Explore: every question, one place

From the first alert to the root cause, without leaving the page. TL;DR: Investigating an incident is a series of quick questions, each one leading to the next. Until now, Explore made you stop between questions to translate them into syntax, switch modes or rebuild a chart. The new Explore lets you go straight from one question to the next: one workspace, any dataset, any team, any way you like to ask. Here’s what that looks like on a real night on call.

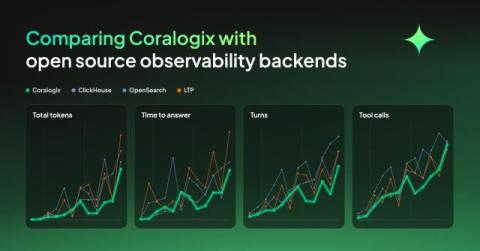
Comparing Coralogix with open source observability backends

We put the same OpenTelemetry data into four backends, Coralogix, ClickHouse, OpenSearch and a Loki, Tempo and Prometheus stack, then set an agent twelve questions against each one, from counting spans to working out what is wrong in a system it has never seen. Then we forced the agents to continue investigating until they got to the right answer. In this experiment, what separated them was the time, tokens, tool calls and turns it took to get there.

Introducing Migration Benchmarks: every source we timed now converts in under an hour

The Coralogix migrations team has published what it measured. Since 2023 the team has moved more than 75,000 assets across 300+ migrations and onboardings, including a single migration of about 41,000 alerts. The new Migration Benchmarks page holds the figures by source, a calculator for your own migration and the causes of delay that post-migration reviews name most.

Debug Production at the Speed of AI

Your coding agent can debug production issues now. Yes… Not just “help you debug.” Actually run the investigation… FOR YOU! In this new era of agentic development, speed matters. And in the old days (you know… last week or so) we used to investigate production bugs ourselves. Manually. Like humans. But for a lot of incidents, we don’t need to do all of that anymore.