Operations | Monitoring | ITSM | DevOps | Cloud

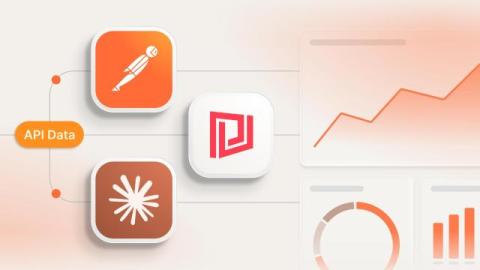
The best ways to visualize API responses in 2026

APIs power almost everything we use today, from cloud platforms and monitoring tools to ticketing systems and internal applications. But no matter how useful an API is, the response usually arrives as raw JSON. That's perfectly fine for machines, but much less convenient for people. Whether you're debugging an endpoint, exploring a new service, or building dashboards for your team, you'll probably want a better way to visualize that data. Fortunately, there are several ways to visualize API responses.

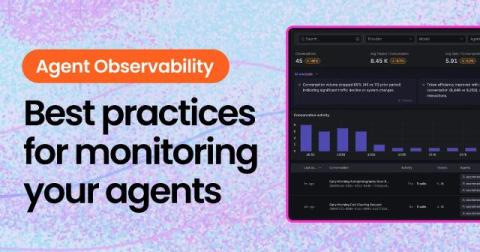
Agent Observability Deep Dive Demo | Grafana Cloud

Grafana AI Observability is our new database and platform for observing AI Agents. Over the past year at Grafana Labs, we built Agents and we needed a way to understand how they are performing, what are the costs associated with them, what's the error rate or time to the first token as well as how they are behaving. Grafana Staff Engineer, Ivana Hučková provides a deep dive demo on how Grafana AI Observability connects our experience building Agents with our experience building observability systems.