Releasing Icinga Director v1.10
We’re excited to announce our next major release for Icinga Director, version 1.10! The new release comes with plenty of fixes, but also with some nice new features. Check out the full changelog for all details.


We’re excited to announce our next major release for Icinga Director, version 1.10! The new release comes with plenty of fixes, but also with some nice new features. Check out the full changelog for all details.
With Icinga Reporting you can create custom SLA reports for hosts and services that are monitored with Icinga. The module for Icinga Web fetches existing data and takes planned downtimes into account. You can filter for certain hosts and services as well as set custom thresholds to highlight unmet SLAs visually. You decide if you want to create the reports either manually or automatically, for example every week or month. The report then is sent to you as a PDF via email.
Similar, to the monitoring module in Icinga Web, Icinga DB Web also provides list views for hosts and services to provide the most common columns to reduce the backend query load.
After some drawbacks we are very happy today to finally release Icinga for Windows v1.10.0! The past weeks we have spent a lot of time to polish this release, test many different aspects and optimize the user experience in general. Please make sure to read the upgrading docs carefully, before upgrading to v1.10.0. Otherwise, your installation might not work as expected, or Icinga for Windows might not load anymore.
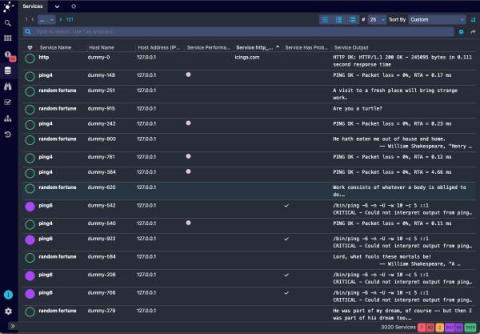
This time I want to show a feature that’s not obvious at first sight, but can save a lot of time, when you’re intending to create UI mockups with realistic data.
Today’s blog post will give an insight into one of the many things that improved with Icinga DB: how host and service history is written to the database, both by the old IDO feature, as well as what has changed with Icinga DB and how this leads to more reliable results.
Infrastructure monitoring is used to collect health and performance data from servers, virtual machines, containers, databases, and other backend components in a tech stack.
Many Icinga users favour the Icinga Director to manage their Icinga configuration. Icinga Director comes with many features to enable you to create and modify Icinga configuration through the web interface. One outstanding feature of Icinga Director is the Activity and Deployment log. It tracks every configuration change and allows you to see who changed what at which time. You can roll back to older versions of your configuration at any time.
It has been a while since we published some news regarding Icinga for Windows – that’s why we would like to tell you one month ahead about a big change which follows with version 1.10 in August.
Last week we released the final first version of Icinga DB and its web interface module Icinga DB Web. Icinga DB Web offers many new features and a completely new design. The monitoring module has its limitations when managing a role, as it handles permissions and restrictions separately. This means that the permissions for a role are not related to the restrictions of the role To understand this better, here is an example.