Operations | Monitoring | ITSM | DevOps | Cloud

How I'm using Grafana and Prometheus to monitor my 3D printing

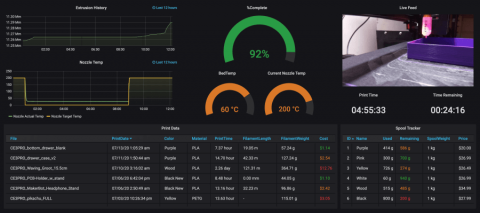
My name is Jonathan Stines, and I am a Penetration Tester for Rapid7, a cybersecurity company located in Austin, Texas. A small handful of my former colleagues at Rapid7 now work at Grafana Labs and have said it was a pretty cool spot to have landed. I had a vague understanding of what Grafana was, but what really struck my interest was when I saw their sweet dashboards in the HBO series Silicon Valley.

All together now: Fleet-wide monitoring for your Compute Engine VMs

Cloud Monitoring has always provided comprehensive visibility and management into individual Compute Engine virtual machines (VMs). But many Google Cloud customers have hundreds, thousands, or tens of thousands of VMs that they need to manage. Cloud Monitoring now gives you zero-config, out-of-the-box visibility into your entire Compute Engine VM fleet, with quick access to advanced Monitoring features such as installing the Cloud Monitoring agent and configuring fleetwide alerts.

Working with a hybrid SquaredUp deployment

Many customers we have are hybrid – meaning they have both Azure and on-prem estate, and subsequently both SquaredUp for Azure and SquaredUp for SCOM deployments. In other cases, some customers are using multiple different deployments of a product, for example for multiple SCOM management groups or multiple Azure tenants.

Creating Azure VM images with Packer and Puppet Bolt

HashiCorp Packer is a free and open source tool for creating golden images for multiple platforms from a single source configuration. Packer makes it easy to codify VM images for Microsoft Azure. In this blog post we’ll look at how to use HashiCorp Packer and Puppet Bolt to define our VM templates in code.

The New Technical Executive: between CIO & CTO

Typically, there are two technical executive leadership roles in most organizations: the Chief Information Officer (CIO) and the Chief Technical Officer (CTO). But there can be confusion between these two positions, a lot of questions when comparing the CIO vs CTO, and often they might actually fuse into a single position depending on the business strategy. Their positions might not be so clear to the people who work for them.

Video: Identifying Memory Bloat

In this video, we are going to take a look at what memory bloat is, what causes it, and how you can use Scout to eliminate it from your applications. Memory related performance issues have the potential to bring your entire application down, and yet, most APMs completely ignore this fact and fail to provide any useful way of monitoring memory usage at all.

Add file attachments to pull requests in Bitbucket Cloud

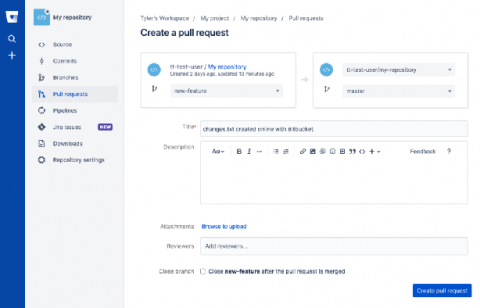
During code review, static image files might not be adequate when a developer wants to demo their changes. Starting now, teams can attach any type of file to a pull request. No need to worry about the file size either. For example, “before and after” screen recordings can be uploaded and viewed directly in a pull request. With this change, Bitbucket Cloud has become more integrated with the Atlassian ecosystem. Does your team also collaborate on Jira or Confluence?

4 Monitoring Alerts to Automate Service Desk Tickets and Reduce Downtime

Whether you’re a small business with fewer than 100 employees or a global enterprise with thousands, having an alert system integrated into the service desk can be invaluable. This type of cross-functional integration can trigger automatic incidents in the service desk based on certain monitoring events, particularly issues that impact a significant portion of employees, including critical applications and network infrastructure.

The Most Important Android Enterprise Features for Supply Chain - Series 2

In my last post, Getting Started With Android Enterprise in Supply Chain – Series 1, we talked about a couple tools you need to understand before jumping into Android Enterprise. Now that we’ve got that sorted out, let’s talk about the features. Not all of the features, but the ones that are going to really matter in supply chain.

Getting Metrics Into Honeycomb

Honeycomb is an event-based observability tool. Rather than relying on the rigid pre-aggregated measures provided by metrics, Honeycomb instead favors using events because they provide a much greater degree of flexibility. But that doesn’t mean metrics don’t belong in Honeycomb. Our new whitepaper, Getting Started With Honeycomb Metrics, breaks down exactly how to do that.