The latest News and Information on Service Center Operations Manager and related technologies.
We are thrilled to announce that among our other big plans for 2021, we have migrated and upgraded our much-loved Community Answers platform! It is now a lot easier to connect with the rest of the monitoring community and get the answers you are looking for.
SCOMathon 2020 was one of the highlights of Microsoft SCOM community-driven events last year. Within a 16-hours marathon on all things SCOM, high-class tutorials were delivered to an excited audience of over 1.000 participants, eager to learn the latest hot topics to evolve their SCOM knowledge. Not to mention the overwhelming runner’s high when crossing the finishing line along with so many like-minded people.
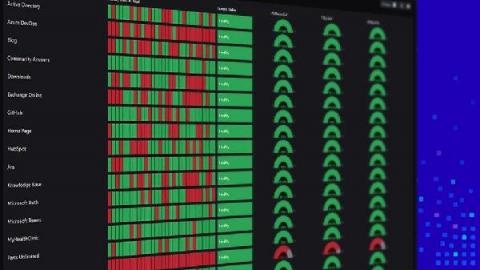
In my position, I get to work with a wide variety of organizations that each have a different level of monitoring maturity. But I’ve noticed an emerging pattern that I’ll call the ‘Critical Service Offering’ or ‘Executive Level Status’ dashboard. At their most basic level, these dashboards should communicate the current health of the application, provide some historical context and, most importantly, not be tied to infrastructure monitoring.
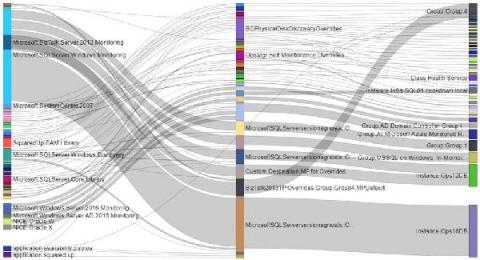
Did you catch our recent webinar on how PowerBI makes it possible to visualize override sprawl in SCOM with Sankey Diagrams and want to give our Sankey diagrams a go yourself? You are in the right place. Before you dive in, take a look at our blog explaining the “why” to using Sankey PowerBI diagrams to see your overrides, and how to take action based on what you see here.
Yup – we've now got a health explorer for Azure VMs! Health Explorer… now why does that sound familiar? You’ve probably guessed it by now, but here’s another hint: Hmm…now where have I seen that before? Right – in SCOM!
Microsoft SharePoint Online empowers 200 million monthly active users worldwide through simple sharing and seamless collaboration, driving team efficiency, maximizing knowledge velocity while bringing a rich digital experience to every device. Launched in 2001, SharePoint celebrates its 20th anniversary in 2021, welcoming new users on a daily basis. Make sure your SharePoint Online users are delighted with the speed and smooth interaction with your Microsoft SharePoint Online services.
In this article I’m going to discuss table joins and the let statement in Log Analytics. Along with custom logs, these are concepts that really had me scratching my head for a long time, and it was a little bit tricky to put all the pieces together from documentation and other people’s blog posts. Hopefully this will help anyone else out there that still has unanswered questions on one of these topics.