Operations | Monitoring | ITSM | DevOps | Cloud

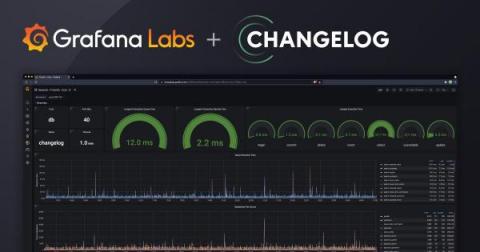
How Changelog monitors and optimizes website performance with Grafana Cloud

Developers around the world get their news from Changelog, an indie media company on a mission to create inspiring content for software developers. Through their popular podcasts, including The Changelog, Go Time, JS Party, and Ship It!, the team at Changelog helps listeners stay up-to-date on the latest happenings, trends, and tools in a constantly evolving industry.
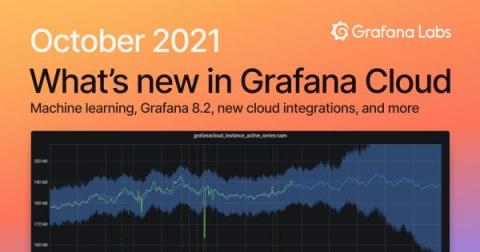
What's new in Grafana Cloud for October 2021: Machine Learning, Grafana 8.2, new integrations, and more

Here at Grafana Labs, we’re constantly shipping new features to help our users get the most out of Grafana Cloud. To help our new and existing customers learn about the latest and greatest, here’s a roundup of all the new features and improvements you should know about to make the most of Grafana Cloud.

A look inside how the Prometheus Conformance Program works and why it's important

Prometheus is the industry standard in cloud native metric monitoring with hundreds of thousands of installations, millions of users, and billions in market value. Speaking as a member of the Prometheus team, we have seen the project become a victim of its own success. While most people may be using Prometheus, not everybody is following the same operating standards.

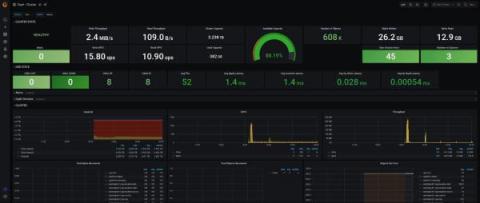
How to monitor a Ceph cluster using Grafana Cloud

Here at Grafana Labs, when we’re building integrations for Grafana Cloud, we’re often thinking about how to help users get started on their observability journeys. We like to focus some of our attention on the different technologies you might come across along the way. That way, we can share our tips on the best ways to interact with them while you’re using Grafana products.

Grafana EMEA meetup recap: accessibility, k6 testing, and multi-DC observability stacks

On Oct. 5, we hosted the first Grafana Virtual Meetup for an EMEA-based audience. Each Grafana meetup features “bite-sized” presentations from our user community and members of the Grafana Labs team. We want to provide opportunities (even virtually!) for members of our community to connect with one another and share what they’re working on or have learned.

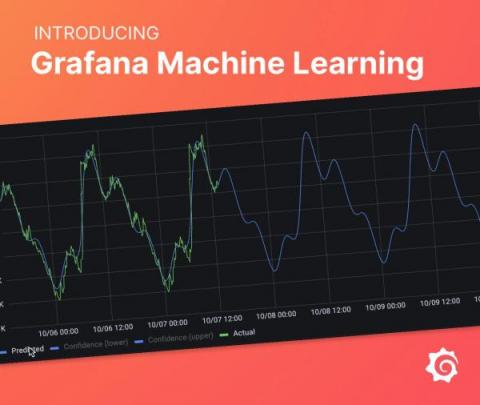
Introducing Grafana Machine Learning for Grafana Cloud, with metrics forecasting

At GrafanaCONline in June, we talked about the future of machine learning at Grafana Labs. Four months later, we are excited to introduce Grafana Machine Learning for Grafana Cloud, with our metrics forecasting capability. It’s available now to all customers on Pro or Advanced plans. If you’re not already using Grafana Cloud, you can sign up for a free 14-day trial of Grafana Cloud Pro here.

How we're building a production readiness review process at Grafana Labs

Production readiness review (PRR) is a process that originated at Google, described as the first step of site reliability engineering engagement in the company’s famous SRE book. The idea of thoroughly reviewing a product before handing over the pager is a really good one, but except for Google-scale companies, there aren’t that many organizations that can afford dedicated SRE teams.

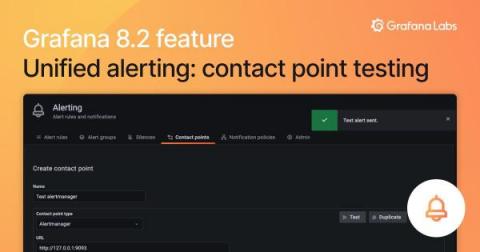
New in Grafana 8.2: Test contact points for alerts before they fire

Grafana 8.2 was released last week, and we’re excited to announce one of its new features: contact point testing. Now users of Grafana 8 alerting can test their contact points right from the contact points page. This feature makes it easier to configure Grafana 8 alerting and gives you the confidence in knowing that your contact points are working as expected before they fire. Here are the basics.

Grafana 8.2 released: Dynamic plugin catalog, new fine-grained access control permissions, and more

Grafana 8.2 is here! This release marks the start of our work focused on measurable improvements to Grafana’s accessibility — part of our continuing mission to democratize metrics for everyone. The initial changes to Grafana in 8.2 are focused on navigation, with more to come. We’ll be sharing more about our accessibility roadmap in an upcoming blog post.

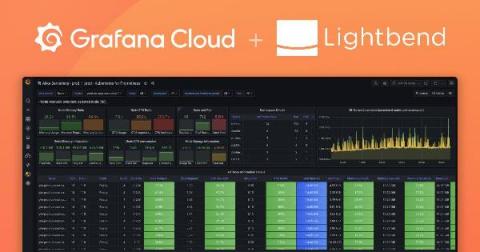
How Lightbend uses Grafana Cloud to monitor a platform-as-a-service launch

When top companies have needed platforms for their demanding, globally distributed, cloud native application environments and streaming data pipelines, they’ve turned to Akka, the most popular implementation of the Actor Model for cloud native applications running on Kubernetes. The company behind Akka is Lightbend, a leader in the world of cloud native applications and architectures.