
Operations | Monitoring | ITSM | DevOps | Cloud

I built an API traffic classifier for business workflows

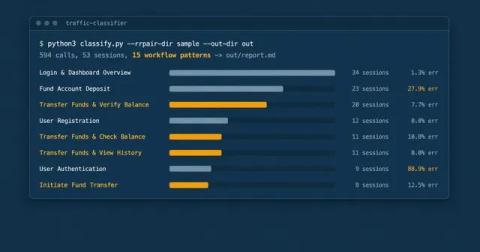
An engineering leader asked me a question a few weeks ago: could we read their business workflows out of API traffic instead of asking people to document them? I said it should be possible. Then I tried it. A few engineers know how the system really works. They know which calls make up a work order and which checks happen after a write. That stuff rarely makes it into the test plan. Usually it’s in somebody’s head. Sometimes it’s in several heads, with slightly different answers.


From Telemetry to Traffic

A metric says latency increased. A log says a request failed. A trace identifies the slow dependency. An APM agent points to the method. Manual instrumentation explains the business operation. Traffic capture shows the exact request and response that triggered it. Each layer answers a question the previous layer could not. Each also introduces a new cost, blind spot, and failure mode.

Reliability Engineering in the AI Era

Engineering leaders have been claiming to “shift quality left” for years but production remains stubbornly stuck out of reach of software engineers. The realm of production remains mysterious with tools no one has access to and UIs that wouldn’t make sense to engineers anyway. I’ve noticed a small but growing trend of large enterprises hiring Reliability Engineers instead of Site Reliability Engineers. Dropping one word looks cosmetic but I think it points to a much bigger change.

Observe Opaque Services With OpenTelemetry eBPF + proxymock

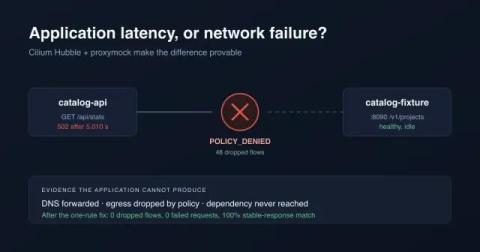
Every SRE team operates services it cannot see into: a vendor binary, an inherited legacy deployment, a container whose owning team dissolved two reorgs ago. The routes are undocumented, the dependencies are unknown, and when a request takes 130 milliseconds nobody can say whether that time is application work or a wait across a network boundary.
Sponsored Post

Flamegraphs Find It. Replay Proves It.

I made an API endpoint 13 times faster. Then I realized my first verification only checked the status, headers, and response schema. I had not checked the totals. I had made the bug faster. That is the problem with giving an AI coding agent one kind of evidence. A CPU profile can show where the application is slow, but not whether an optimization preserves behavior. A traffic replay can prove that behavior stayed stable, but not explain why the code burns CPU. This walkthrough gives the agent two independent witnesses: Together, they turn AI code verification into an experiment with two independent checks.

The Pod Was Cheaper. The Service Wasn't.

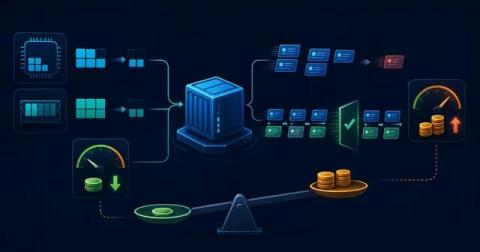
A smaller Kubernetes pod can lower allocation cost while completing less work. Green status codes and matching schemas can hide it. This walkthrough combines OpenCost allocation data with proxymock behavior and performance evidence. A candidate passes only when behavior and throughput hold while unit cost falls.

Diagnose Serial N+1 API Calls With Tempo + proxymock

One API request took 302 milliseconds. Nothing failed. CPU was mostly idle. The response was correct. The trace made the problem obvious: eight inventory calls, each waiting for the previous one. But the trace could not tell me why the application made eight calls, or whether changing their execution would preserve the response. It showed the shape of the wait, not the input that created it.

eBPF: Preventing Garbage HTTP Payloads When Reading Kernel Scatter-Gather Buffers

Recently someone on our team opened a traffic snapshot and found an HTTP request that was captured with our eBPF capture agent, nettap. Our protocol dissector parsed most of the response correctly, but that correctness ended once the response headers were processed. What they ended up with was a recording of an HTTP request/response where the response body was just an incorrect collection of garbage binary data when it should have been JSON text.