Operations | Monitoring | ITSM | DevOps | Cloud

Bleemeo and ilert: two European companies, one alerting chain

Some alerts only need to reach a Slack channel. Some need to reach one specific person, at 3am, and keep trying until they answer. For the second kind, we are partnering with ilert — an incident response platform covering the full lifecycle: from the moment an alert arrives, through paging the right responder, coordinating the response, telling customers what’s happening, and learning from it afterwards. The integration is live today, on both sides.

Log ingestion: you are probably paying to store logs you will never read

The default way to adopt log management is to ship everything and search it later. It is the path every vendor’s quickstart puts you on, and it is the reason log bills surprise people: ingestion is priced by volume, so“ship everything” is a spending decision disguised as a configuration default. The uncomfortable part is that most of that volume is never read. Nobody greps last Tuesday’s 200 OK access lines.

Monitoring Fundamentals in Six Lessons: From Golden Signals to Error Budgets

Summer is the perfect time to step back from the alert stream and revisit the ideas your whole monitoring practice quietly rests on. Not the newest tool or the shiniest dashboard — the fundamentals: what to measure, how to read it, when to wake someone up, and what to do when something breaks at 2 a.m. We packed six of those fundamentals into a free, no-signup PDF — The DevOps & Monitoring Summer Workbook, complete with hands-on exercises and an answer key.

Monitoring Protocols Compared - Which Standard for What

Modern applications are distributed, ephemeral and built from a dozen moving parts. To keep them reliable, you need real visibility: not just “is the server up?”, but“how is this request behaving, right now, across every component it touches?”. The good news is that the observability world has converged on a handful of open standards.

Lightweight Server Monitoring - One Binary, No Stack

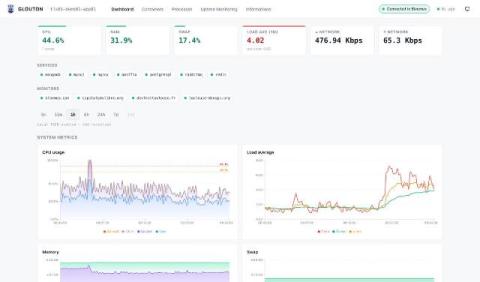
Monitoring a single server should not require running four daemons. Yet the default open-source recipe for “I just want to watch this one box” still looks like this: install node_exporter, stand up a Prometheus server to scrape it, add Grafana to draw the graphs, and bolt on Alertmanager so you actually hear about a full disk. That is a lot of moving parts — and a lot of YAML — for one machine. This post shows a lighter path.