Operations | Monitoring | ITSM | DevOps | Cloud

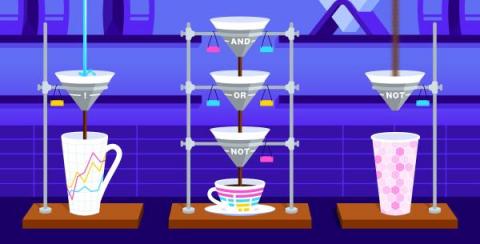
Introducing Boolean-filtered metric queries

Health and performance issues are easier to understand—and to troubleshoot—when you can use tags to aggregate your data across many overlapping scopes. But while some scopes come directly from your infrastructure, others are constantly evolving to reflect the needs of your product or organization. You can only track your data effectively if you can define—and redefine—your scopes on the fly.

Monitor Alcide kAudit logs with Datadog

Kubernetes audit logs contain detailed information about every request to the Kubernetes API server and are critical to detecting misconfigurations and vulnerabilities in your clusters. But because even a small Kubernetes environment can rapidly generate lots of audit logs, it’s very difficult to manually analyze them.

Monitor AWS Step Functions with Datadog

AWS Step Functions is a service that abstracts distributed applications into state machines, with each state representing a component of an application. Not only does this automatically generate an architectural diagram of your application’s workflow, it also makes it straightforward to reorder your states as well as implement parallel execution, retries, and other tasks.

Exclaimer: Shortening the lengths of incidents with Datadog

Hear how Matt Hodge from Exclaimer leverages Datadog Log Management to migrate away from a homegrown solution and find one platform to manage dev and ops logs. Through deep integrations with Microsoft Azure, Exclaimer is able to gain rapid visibility into their entire Azure-based infrastructure as well.

Monitor containers on Amazon Bottlerocket with Datadog

Amazon’s Bottlerocket is a new Linux-based open-source operating system that’s designed with containers in mind. Bottlerocket is optimized and stripped down to only the essential software needed to run containers. You can apply updates to Bottlerocket in a single step, and roll them back instantly if necessary. And, because it’s open-source, you can customize the operating system to fit your specific needs.

NodeJS Instrumentation - Adding Custom Tags to Spans | Datadog Tips & Tricks

In part 1 of this 4 part series, you’ll learn how to use manual instrumentation to add additional detail to traces. We’ll add new tags, or attributes, to the spans generated by our NodeJS application, allowing for more insightful data visualizations in App Analytics.

NodeJS Instrumentation - Creating Custom Spans for Method-Level Visibility | Datadog Tips & Tricks

In part 2 of this 4 part series, you’ll learn how to instrument your NodeJS application to capture custom method-level spans, allowing visibility into how specific methods behave in your application. Flame graphs allow for deep insight into the performance of your code. During instrumentation, we can capture custom spans for deeper layers of visibility in the resulting flame graphs. In this video, we use instrumentation to capture a method-level span, allowing us to see the performance of that specific method in our flame graphs in the Datadog UI.