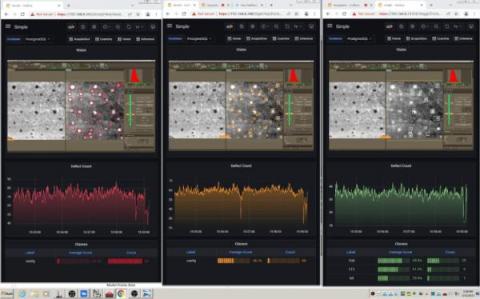
Dr. Christopher Field is Co-Founder, President, and Principal Investigator at Theia Scientific. With formal education in analytical chemistry and instrumentation, Chris has expertise in scientific hardware and software design, deploying embedded Linux devices for Internet of Things (IoT) and sensor fusion applications, and developing computer vision and image processing pipelines for cell analysis.
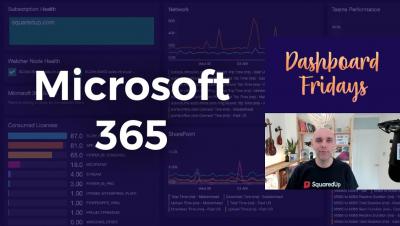
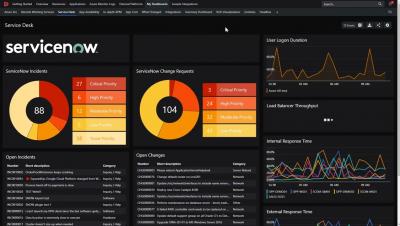
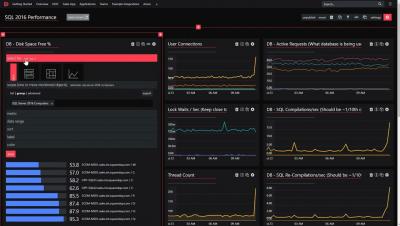
Since its origins as MOM 2000, SCOM has been widely regarded for being awesome at two things: firstly, being the hands-down best solution for monitoring Windows Server environments (it is Microsoft’s monitoring tool, after all); and secondly, being an extensible monitoring platform that can act as a single pane of glass across your data center environment.
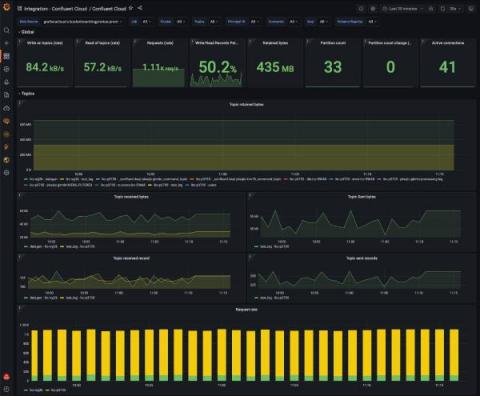
At Grafana Labs, we’re continuing to expand our platform of Grafana Cloud integrations that make it easier than ever to connect and monitor external systems. These integrations enable you to answer the big picture questions in your organization and tell your observability story.
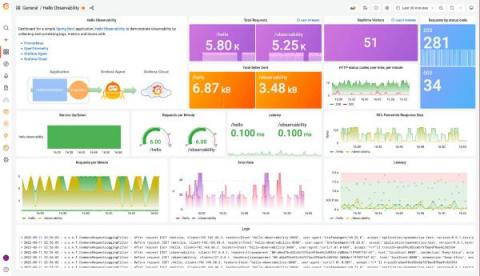
Spring Boot is a very popular microservice framework that significantly simplifies web application development by providing Java developers with a platform to get started with an auto-configurable, production-grade Spring application. In this blog, we will walk through detailed steps on how you can observe a Spring Boot application, by instrumenting it with Prometheus and OpenTelementry and by collecting and correlating logs, metrics, and traces from the application in Grafana Cloud.
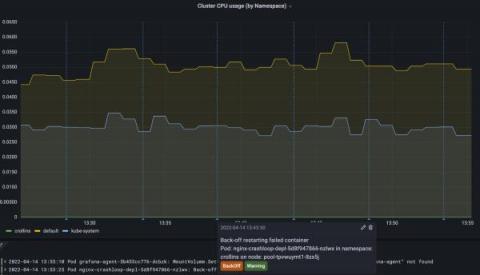
The Kubernetes integration for Grafana Cloud helps users easily monitor and alert on core Kubernetes metrics using the Grafana Agent, our lightweight observability data collector optimized for sending metric, log, and trace data to Grafana Cloud. It packages together a set of easy-to-deploy manifests for the Agent, along with prebuilt dashboards and alerts.
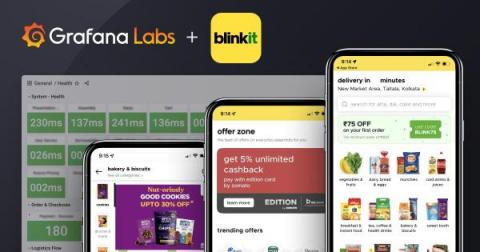
The promise: Order any groceries and essentials from Blinkit’s mobile app, and they’ll be delivered to your doorstep within 10 minutes. The process: Very difficult with a legacy logging tool. For Blinkit, the instant delivery service formerly known as Grofers that serves millions of consumers across India, their tech stack was beginning to interfere with business operations at a time when the company was hyperscaling due to its popularity.
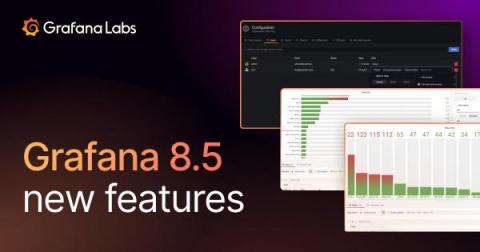
Grafana 8.5 is here! Download Grafana 8.5 We’ve worked on a variety of improvements that focus on Grafana’s usability, data visualization, and security. For a full list of new features and capabilities, check out our What’s New in Grafana 8.5 documentation. You can get started with Grafana in minutes with Grafana Cloud. We have free and paid Grafana Cloud plans to suit every use case — sign up for free now.
In 2019, Alexander Mann was working in the microchip industry, putting in 12-hour shifts that left no time for him to tend to his large vegetable garden. “I started looking for ways that I could remotely water or check on my plants,” he says. Products that could help him were either too costly for a hobby gardener or required special internet connections, so Mann decided to learn about IoT and create his own setup.
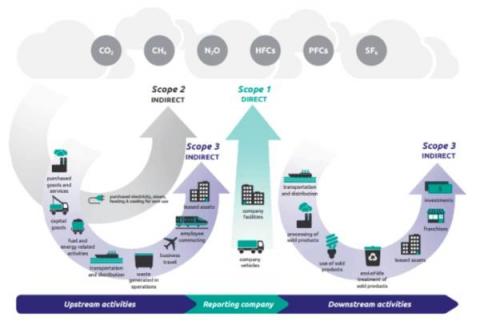
Simple questions can be overwhelming and not knowing the answer after a mouse click is no longer an option: Sustainability is top of mind for organizations across all verticals and Splunk can help with the power of data. Our upcoming Sustainability Toolkit based on the Splunk platform equips organizations with capabilities to gain deep insights into their carbon footprint and as such empowers them to take the necessary actions towards their carbon neutrality goals.
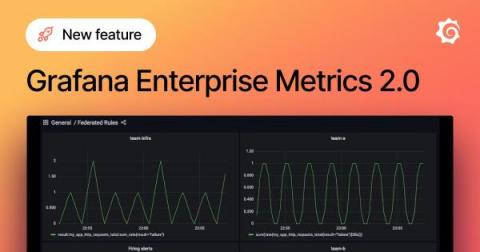
On the heels of launching our new open source TSDB Grafana Mimir, we are excited to introduce Grafana Enterprise Metrics 2.0. GEM 2.0 is built on top of Grafana Mimir 2.0, our easy-to-operate, high-scale database which we’ve shown can handle upwards of 1 billion active series. That means that GEM 2.0 inherits all of the highlights of Mimir, including easy deployment, native multi-tenancy, high availability, durable long-term metrics storage, and exceptional query performance.
The long awaited SCOM 2022 is here! If you’d like to know what improvements to expect, check out our blog on SCOM 2022 key highlights. If you’re as excited as we are and would like to proceed with your upgrade, keep reading, this is the detailed step-by-step guide you are looking for. We will take you through the whole process, covering: Stick with us, and by the end of this blog you’ll have successfully upgraded to SCOM 2022!
Back when everyone was talking about the ‘new normal’ and what the future of work would look like post-pandemic, SquaredUp was having a rethink too. SquaredUp has always been a 100%, office-based company with a heart for bringing people together. Richard Benwell, CEO, and the executive team had created a company that is truly fun, collaborative, and integrated, largely based on their drive to keep people connected and build an incredible community – in the office.
Today, I’m happy to share that Grafana Labs has closed a $240 million Series D round of investment. This is a major milestone for us that goes well beyond the number of dollars. First, we are grateful to our internal team (affectionately called Grafanistas) and our community of users and customers. Without them, we would not have been given this opportunity.
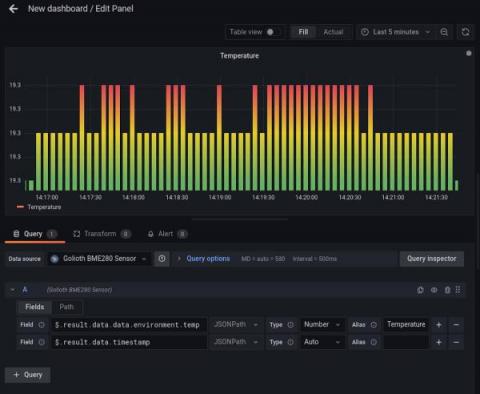
Mike Szczys is a Developer Relations Engineer at Golioth. His deep love of microcontrollers began in the early 2000s, growing from the desire to make more of the BEAM robotics he was building. When he’s not reading data sheets, he’s busy as an orchestra musician in Madison, Wisconsin. At Golioth, a commercial IoT development platform, we love using the power of Grafana to easily visualize data from IoT installations where tens, hundreds, or even thousands of devices are reporting back.