Grafana Labs in 2021: Top 10 moments of the year
Here’s a look back at the releases, products, community stories, and major announcements that defined another incredible year for Grafana Labs.


Here’s a look back at the releases, products, community stories, and major announcements that defined another incredible year for Grafana Labs.
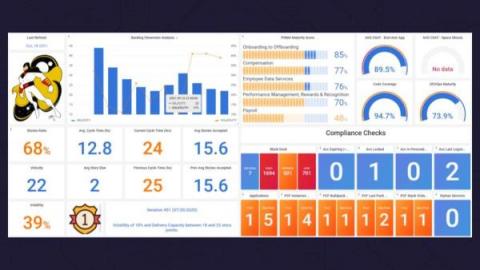
Ever known a project manager who thinks a task takes minutes when it really takes hours? One company has developed a helpful monitoring tool that not only helps project managers make more realistic estimates, but also helps product teams save time, increase efficiency, and improve their overall performance. At ObservabilityCON 2020, Walter Ritzel Paixão Côrtes, a product designer at Dell, gave a presentation about a data-driven solution his team developed called Product Team Observability.
On Dec. 8, we gathered the Grafana EMEA community for another dynamic meetup. Experts from the Grafana Labs and k6 teams alongside observability pros from different organizations covered topics ranging from shift left observability practices to monitoring your green thumb at home with Grafana. In case you missed the virtual get together, here’s a recap of each talk along with the session videos.
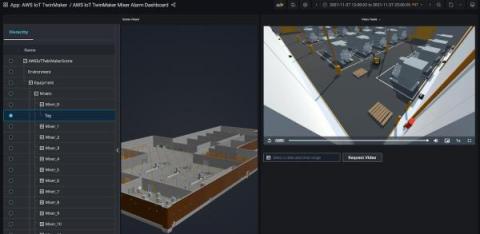
At re:Invent this year, AWS announced its new digital twin service, AWS IoT TwinMaker (in preview), which allows users to create digital twins of real-world systems like buildings, factories, industrial equipment, and production lines. Using a digital twin to monitor and improve operations for a physical system requires ingesting data from IoT sensors, process instruments, cameras, and enterprise systems, and curating and associating data from these disparate sources.
On Nov. 8, I started as the new Chief Information and Security Officer at Grafana Labs. In my first five weeks, I’ve met about 100 really amazing people; learned and absorbed early lessons about our workplace culture; kicked off working groups for our 2022 initiatives (bug bounty FTW); and contributed to tackling our first-ever 0day. Amid all of that, I’ve also been doing a lot of thinking.
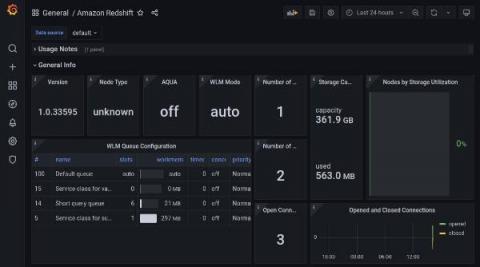
In collaboration with the AWS team, we have recently released the new Redshift data source plugin for Grafana. Amazon Redshift is the fastest and most widely used cloud data warehouse. It uses SQL to analyze structured and semi-structured data across data warehouses, operational databases, and data lakes by using AWS-designed hardware and machine learning.
Monitoring is usually associated with servers and applications, but the fintech automation platform Ocrolus recently needed to set up monitoring for a different purpose: to gain meaningful data and insights about nearly 1,000 remote user workstations.
We’re thrilled to announce the addition of the Sentry data source plugin to Grafana. Grafana Labs worked in partnership with Sentry, the code observability platform, to help development teams see the issues that matter and solve them faster — across their entire tech stack — so they can remove silos and ship with confidence.
Amazon CloudWatch has recently launched Metrics Insights (Preview) — a fast, flexible, SQL-based query engine that enables you to identify trends and patterns across millions of operational metrics in real-time. With Metrics Insights, you can easily query and analyze your metrics to gain better visibility into the health and performance of your infrastructure and large scale applications.