
The latest News and Information on Containers, Kubernetes, Docker and related technologies.
If you’re an SRE or on a DevOps team working with Kubernetes and containers, you’ve undoubtedly encountered network connectivity issues with your microservices and workloads. Something is broken and you’re under pressure to fix it, quickly. And so you begin the tedious, manual process of identifying the issue using the observability tools at your disposal…namely metrics and logs.
The new Honeycomb Kubernetes agent is out! This post describes how infrastructure metrics contribute to observability, and then walks you through the steps to start sending your own Kubernetes data into Honeycomb. Follow the steps to start observing your infrastructure in production!
Kubernetes is increasingly becoming a uniform standard for computing – in Edge, in core and in the cloud. At NTS, we recognize this trend and have been systematically building up competencies for this core technology since 2018. As a technically-oriented business, we regularly validate different Kubernetes platforms and we share the view of many analysts (e.g. Forrester or Gartner and Gartner Hype Cycle Reports) that Rancher Labs ranks among the leading players in this sector.
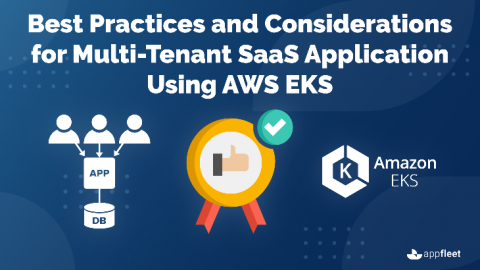
Today, most organizations, large or small, are hosting their SaaS application on the cloud using multi-tenant architecture. There are multiple reasons for this, but the most simple and straightforward reasons are cost and scalability. In a multi-tenant architecture, one instance of a software application is shared by multiple tenants (clients).
While developing Docker images for Icinga 2, Icinga Web 2 and Icinga DB we stumbled over OpenShift which doesn’t allow images to run as root by default. One has to enable that explicitly. Also admins of K8s environments being more permissive by default may decide not to allow running as the superuser. So we’ve added a USER directive to our Dockerfiles to make our customers‘ compliance departments happy.
The most common problems and outages in a Kubernetes cluster come from coreDNS, so learning how to monitor coreDNS is crucial. Imagine that your frontend application suddenly goes down. After some time investigating, you discover it’s not resolving the backend endpoint because the DNS keeps returning 500 error codes. The sooner you can get to this conclusion, the faster you can recover your application.