

Operations | Monitoring | ITSM | DevOps | Cloud

Measuring Success with Sentry

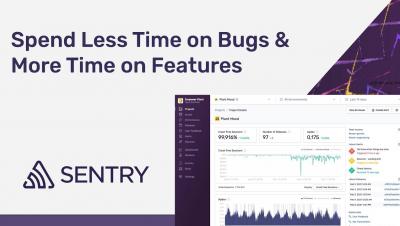
In the early days of web development, there was one way to measure code: WTFs per minute. It was a metric that could be applied across all languages, as every developer knew what WTF meant (Works That Frustrate, obviously). Today, however, code is too intricate — and important — for clever, opaque metrics. You need objective data that communicates the quality and stability of your code — KPIs such as events accepted, transaction outcomes, and crash-free sessions.

Supporting Native Android Libraries Loaded From APKs

Like mechanics who restore their own cars or plastic surgeons who self-rhinoplasty, our developers put their skills to interesting uses during their free time. Here, Native Platform Engineer, Arpad Borsos breaks down how memory mappings and dynamic library loading works and how it relates to native Android libraries loaded from APKs. Libraries are key to modular programming, as they offer functionality in a single unit which can be shared with other developers.

No-code Lambda Monitoring

Auto-instrumenting Lambda Monitoring didn’t originate through a focus group or business plan. It started as a hackathon project in which our growth team used Cloudwatch to build a prototype that could instrument Lambda functions with Sentry. We did this by using Cloudformation’s stack to automatically create resources in a customer environment while streaming CloudWatch Logs to Sentry through the Kinesis Firehose.

Measuring User Experience with Web Vitals

Top of search for you means top of mind for your customers. And with Google’s upcoming Page Experience update to Web Vitals taking place in a few weeks, now’s the right time to optimize your user experience. But before you can optimize your user’s experience, you need to be able to measure it. We’re kicking off Measurement May by breaking down breaking down how Google uses Web Vitals data — and how you can instrument that data with Sentry.