Operations | Monitoring | ITSM | DevOps | Cloud

The latest News and Information on Distributed Tracing and related technologies.

OpenTelemetry vs Datadog - Choosing the Right Monitoring Tool

OpenTelemetry and DataDog are both used for monitoring applications. While OpenTelemetry is an open source observability framework, DataDog is a cloud-monitoring SaaS service. OpenTelemetry is a collection of tools, APIs, and SDKs that help generate and collect telemetry data (logs, metrics, and traces). OpenTelemetry does not provide a storage and visualization layer, while DataDog does.


Jaeger vs. Grafana Tempo: A Comprehensive Comparison for Distributed Tracing

When it comes to monitoring, diagnosing, and optimizing the performance of complex systems today, you can’t really go wrong with tracing tools. And while OpenTelemetry has become the go-to choice for instrumenting apps and collecting traces, there are several other options in the backend that can effectively store, manage, and analyze traces sent by OpenTelemetry. Two of these open-source tools are Jaeger and Grafana Tempo. In this article, we’ll compare and contrast the two.

How to Monitor JVM with OpenTelemetry

The Java Virtual Machine (JVM) is an important part of the Java programming language, allowing applications to run on any device with the JVM, regardless of the hardware and operating system. It interprets Java bytecode and manages memory, garbage collection, and performance optimization to ensure smooth execution and scalability. Effective JVM monitoring is critical for performance and stability. This is where OpenTelemetry comes into play.

An Overview of the OpenTelemetry Collector's Configuration File

In this video, I’ll provide an overview of the OpenTelemetry Collector’s configuration file (config.yaml) with examples from the Splunk distribution. I will briefly explain the components of the Splunk OTel Collector, and walk you through a sample generic configuration of the OTel Collector. We’ll then use the Splunk Observability Cloud interface to construct the commands needed to install the Splunk OTel Collector on a specific host. This installation will copy a default Splunk OTel Collector configuration onto the host, and we’ll review the Splunk specific components of this configuration.

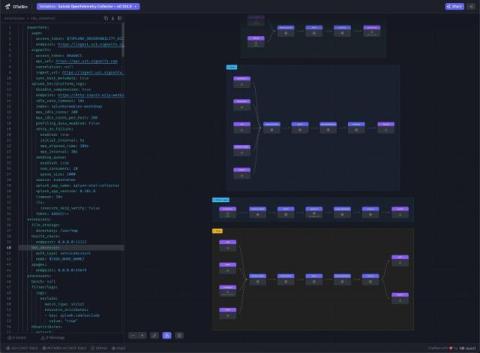
Setting up and Understanding OpenTelemetry Collector Pipelines Through Visualization

Observability provides many business benefits, but comes with costs as well. Once the (not-insignificant) work of picking a platform, taking an inventory of your applications and infrastructure, and getting buyin from leadership (both from the business and engineering sides of the house) is done, you then have to actually instrument your applications to emit data, and build the data pipeline that sends that data to your observability system.

OpenTelemetry Is The Strategic Choice

OpenTelemetry (OTel) should be at the heart of your observability strategy. There is no longer a need to pay for the collection of telemetry data; instead, use the unified OTel standard for all your telemetry data. Once you have the data in a standard form, you can choose where to process it, either on your own servers or via one of many SaaS providers.

How to Ship AWS Cloudwatch Logs to Any Destination with OpenTelemetry

Observability and log management are needed for a strong IT strategy. Two essential tools for these purposes are AWS CloudWatch and OpenTelemetry. AWS Cloudwatch provides real-time data and insights into AWS-powered applications' health, performance, and efficiency. On the other hand, OpenTelemetry is an open-source observability framework that assists developers in creating, gathering, and exporting telemetry data (such as traces, metrics, and logs) for analysis.