Operations | Monitoring | ITSM | DevOps | Cloud

The latest News and Information on Observabilty for complex systems and related technologies.

Sponsored Post

The Right Time to Right-Size Your Observability Process

Every client we meet has been using multiple tools to satisfy their observability needs. We rarely find a greenfield opportunity. As their journey progresses, they have pointed out when the time is right to add ChaosSearch into the fold. There isn't just one symptom; it's usually a combination of things, including high log data volume, unpredictable costs, and ineffective results, to name a few. By the time we talk to clients in this state, the pain and frustration are incredibly high. We created a five-minute video to demonstrate how clients find themselves in this predicament.

How to Get Full Kubernetes Observability in Minutes

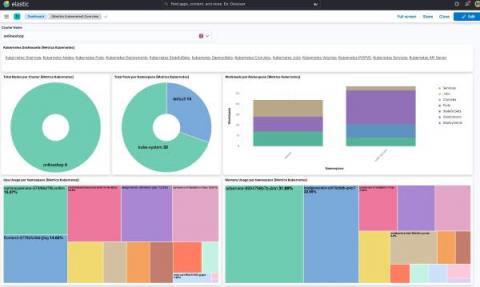
How is your organization handling Kubernetes observability? What tools are you using to monitor Kubernetes? Is it a time-consuming, manual process to collect, store and visualize your logging, metrics and tracing data? And, what are you actually getting out of all that investment? At Logz.io we’re trying to make this process easier for customers who are serious about Kubernetes observability. We’ve made significant investments in this area for Kubernetes use cases.

Achieving Full Observability With Telemetry Data

In today's digital age, organizations increasingly depend on their technology infrastructure to keep their operations running smoothly. These infrastructures include servers, networking equipment, IoT devices, and applications. The data generated by all this infrastructure (logs, metrics, traces) is known as telemetry data, which has a tremendous potential value to organizations. However, it can be challenging to control telemetry data and utilize it effectively.

Monitoring with Prometheus vs Grafana: understanding the difference

Observability has become one of the most important areas of your application and infrastructure landscape, and the market has an abundance of tools available that seem to do what you need. In reality, however, most products - especially leading open source tools - were created to solve a single problem extremely well, and have added additional supporting functionality to become a more robust solution; but the non-core functionality is rarely best of breed. Examples of these are Prometheus and Grafana.

How Developers Use Observability Pipelines

In data management, numerous roles rely on and regularly use telemetry data. The developer is one of these roles. Developers are the creative masterminds behind the software applications and systems we use and enjoy today. From conception to finished product, they map out, build, test, and maintain software.

Surface and Confirm Buggy Patterns in Your Logs Without Slow Search

Incidents happen. What matters is how they’re handled. Most organizations have a strategy in place that starts with log searches—and logs/log searching are great, but log searching is also incredibly time consuming. Today, the goal is to get safer software out the door faster, and that means issues need to be discovered and resolved in the most efficient way possible.

Observability Innovation Report 2023

StackState commissioned Techstrong Research, a strategy and technology analyst firm, to delve into the current state of observability. The resulting report, “Observability Innovation Report 2023,” provides insightful information. 543 IT professionals were surveyed, globally, across 20 industries. The largest concentration of respondents were in the telecommunications, technology, Internet and electronics sectors, followed by financial services.

Maximizing Value and Minimizing Costs: Insights and Next Steps for Effective Tool Deployment

Cribl’s Ed Bailey and Optiv’s Randy Lariar talk about what teams should consider once they acquire a new tool. The hard work starts after the purchase. How do you get maximum value and minimize deployment costs from your new solution? Ed and Randy will offer insight and some suggestions for next steps.

OpsVerse Webinar: Effective Frontend Monitoring 101

Frontend observability (o11y) provides deep visibility into how web applications are running, and is an invaluable tool for data-driven tech teams to track app performance and identify bottlenecks. In this webinar, we'll walk through how you can easily instrument your webapps to generate rich, qualitative metrics for your apps.