Operations | Monitoring | ITSM | DevOps | Cloud

Introducing Infrastructure Knowledge: Teach Netdata AI What Your Metrics Can't Show

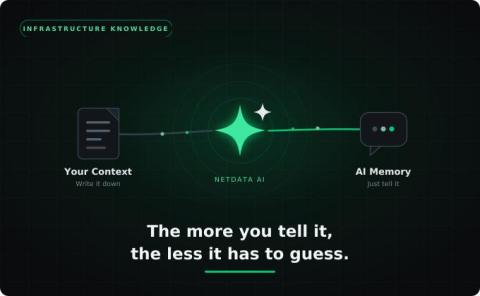
Netdata AI sees everything your infrastructure does: every metric, every anomaly, every alert. It does not see what your infrastructure is: which services matter, which host is supposed to run hot, who owns what, what your team considers normal. Without that context, “CPU at 91%” is just a finding. With it, it might be a machine doing exactly its job.

Chart Annotations: Pin the Deploy, the Incident, or the Config Change Right on the Chart

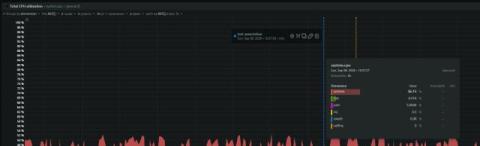
A chart shows you that CPU jumped at 15:57. It doesn’t show you that a deploy went out at 15:56. Chart annotations let you pin a note to the exact moment on a chart, and it stays there for everyone in your Space, permanently, the next time anyone looks at that chart.

Introducing MCP Connections: Netdata AI Now Reads From the Tools You Already Run

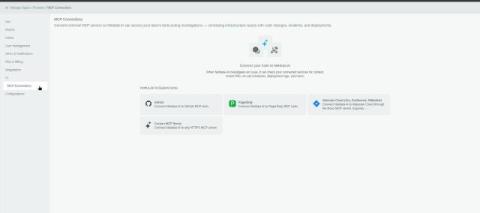
Netdata AI can now connect outward to the tools your team already runs, like GitHub, PagerDuty, Atlassian, or any custom MCP server, and read from them during an investigation. We call this MCP Connections. It’s the missing piece in the middle of every root-cause investigation: the alert tells you what changed, but the why is usually somewhere else entirely.

Native macOS Monitoring: Logs, Sensors, GPU & Hardware Health

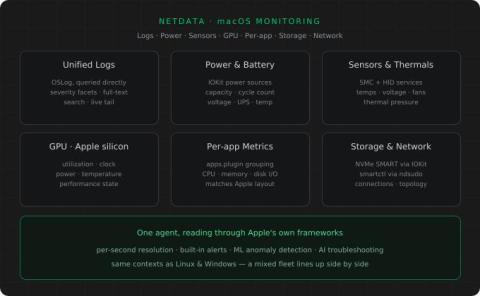
We’ve overhauled macOS monitoring in the latest Netdata release. Netdata already collects system metrics on Macs at per-second resolution; this release completes the picture with logs and hardware telemetry, areas that previously required users to run CLI tools like log show and powermetrics. The new collectors read this data through Apple’s own frameworks, allowing users to trace application and OS errors and catch hardware issues early.

Real Time Network Monitoring: Topology, NetFlow, SNMP

Interface counters tell you a port is busy. Bytes in, bytes out, errors, drops. That’s enough to know a link is saturated, but not enough to know which conversations are saturating it, which devices are involved, or how a problem propagates across your network. For that you’ve traditionally needed dedicated network performance monitoring tools, usually expensive, usually a separate console from the rest of your monitoring.

High Cardinality Metrics At Scale: A Better Playbook

The “high cardinality is expensive” sentence has become observability’s version of “in this economy” — said so often that nobody questions whether it’s true. Every vendor pricing page invokes it. Every glossary article repeats it. Every architecture diagram shows aggregation buffers placed before the storage layer.

Netdata Skills: Teach Your AI Coding Agent To Monitor

There’s a growing ecosystem of AI coding agents: Claude Code, Cursor, Copilot, Codex, Gemini CLI, Windsurf, and others. They’re good at writing code, but they don’t inherently know how to instrument that code for observability, configure monitoring infrastructure, or troubleshoot production systems using real telemetry data. That knowledge lives in documentation, runbooks, and the heads of your senior SREs.

Dashboard Playlists: Cycle Through Dashboards in TV Mode

When we shipped TV mode, we heard almost immediately: “Great, but I have five dashboards and one screen.” A single dashboard on a wall display covers one view of your infrastructure. If you want to rotate between your network overview, database health, application metrics, and infrastructure summary, someone has to walk over and click, or you’re buying more screens. Dashboard playlists solve this.