Operations | Monitoring | ITSM | DevOps | Cloud

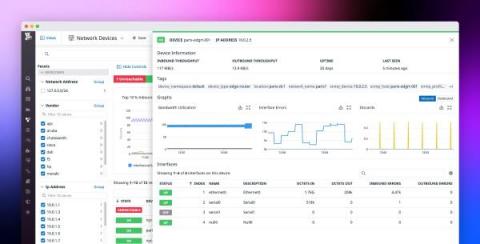
Introducing Network Device Monitoring

For many organizations, the success of their business depends on their ability to maintain on-prem or hybrid infrastructure. For instance, some companies rely on data centers for security reasons or to support their large, static workloads, while others must execute their critical business processes as close to the edge as possible to ensure minimal latency.

Dash 2021: Guide to Datadog's newest announcements

Today at Dash 2021, we announced new products and features that give your team even greater visibility into the health and performance of your code, databases, CI/CD pipelines, and more. Now, you can monitor network devices, get visibility into your services' golden signal metrics without touching a single line of code, and integrate third-party tools into our platform with Datadog Apps. We expanded RUM to include iOS error tracking, Session Replay, and Watchdog Insights.

Monitor your CircleCI environment with Datadog

Datadog CI Visibility provides a unified platform for monitoring your CI/CD pipelines. Now, we are partnering with CircleCI to extend that same critical visibility to your CircleCI environment. Datadog’s integration uses CircleCI webhooks to capture information about the status and performance of your workflows and associated jobs, such as a job’s duration and whether or not it failed or was canceled.

Explore Azure App Service with the Datadog Serverless view

Azure App Service is a platform-as-a-service (PaaS) offering for deploying applications to the cloud without worrying about infrastructure. App Service’s “serverless” approach removes the need to provision or manage the servers that run your applications, which provides flexibility, scalability, and ease of use. However, App Service also introduces infrastructure-like considerations that can impact performance and costs.

Resolve AWS Lambda function failures faster by monitoring invocation payloads

In a serverless application, AWS Lambda functions are typically invoked by JSON-formatted events from other AWS services—like API Gateway, S3, and DynamoDB—and respond with JSON-formatted payloads. Having visibility into these function request and response payloads can provide context around your function invocations and help you uncover the root causes of Lambda function failures.

Filter dashboards faster with template variable available values

Datadog’s template variables help you quickly scope your dashboards to specific contexts using tags, so you can visualize data from only the hosts, containers, services, or any other tagged objects you care about. This helps you build more flexible dashboards so you can access the insights you’re looking for as quickly as possible. We’re proud to announce new features for the template variable workflow that enable you to make highly dynamic, shareable dashboards more efficiently.

Debug iOS crashes efficiently with Datadog RUM

Unsurprisingly, application crashes due to fatal errors can be a major pain point for iOS users. Recent research shows that roughly 20 percent of mobile application uninstalls were due to crashes or other code errors. As a developer, it’s paramount to manage this potential churn by capturing comprehensive crash data in order to track, triage, and debug recurring issues in your iOS apps.

Announcing Support for AWS Lambda Functions running on AWS Graviton2 processors

AWS Graviton2 processors use the Arm architecture to provide high-efficiency, low-cost computing. AWS already offers the ability to provision EC2 instances powered by Graviton2, and Datadog is proud to partner with them for the launch of new Graviton2 compute resources for Lambda functions. In this post, we’ll discuss how Datadog can provide deep visibility into your Lambda functions across whichever platform you’re using.

Best practices for writing incident postmortems

After you have stopped an incident from affecting your customers, you need a more thorough investigation in order to prevent similar incidents in the future. Postmortems record the root causes of an incident and provide insights for making your systems more resilient. At the same time, postmortems can be difficult to produce, since they require deeper analysis and coordination between teammates who are busy with the next development cycle.

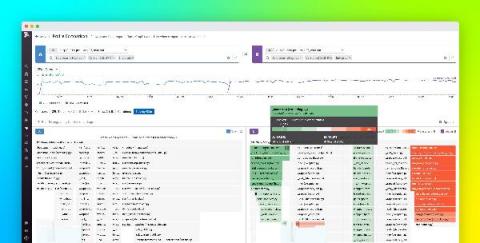
Compare and optimize your code with Datadog Profile Comparison

Code profilers offer detailed insight into the efficiency of application code by measuring things like the execution time and resource utilization of a service. Datadog’s always-on, low overhead Continuous Profiler provides snapshots of code performance for a service that are tagged with key metadata (e.g., region, service, release), so you can easily identify and optimize inefficient code.