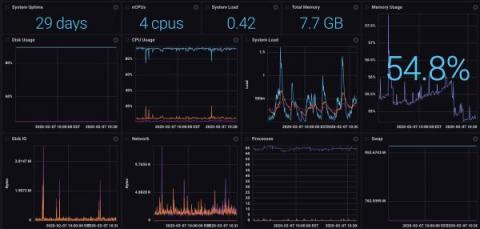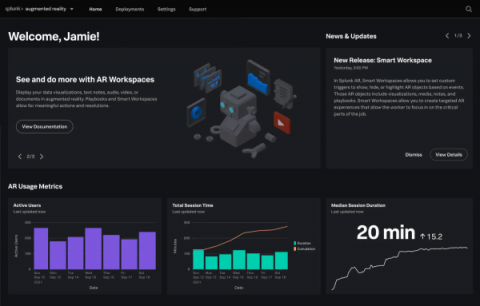
In an increasingly data-driven world, the ability to summarize and display data while making it easy to understand and actionable is more important than ever. Dashboards appear in all types of software with various approaches behind their design. Despite how they differ in appearance and the information they display, at a conceptual level all dashboards have the same goal and purpose.
In 2021, Splunk AR is better than ever. We’ve launched many features in both the Splunk AR mobile app and the Splunk App for AR web app. In this blog post, we’ll talk about these updates and go in detail about the exciting features in Splunk AR 4.0 and Splunk App for AR 2.0.
During.conf21, we announced the public release of the Splunk UI Toolkit, a collection of packages and libraries that provides some of the same underlying tools powering our product line to you, the Splunk developer. Now, any Splunk developer can incorporate Splunk UI components into their own custom applications and tools. This includes everything from buttons and inputs from our @splunk/react-ui package, or our new parallel coordinates visualization from our @splunk/visualizations package.