Operations | Monitoring | ITSM | DevOps | Cloud

The latest News and Information on Distributed Tracing and related technologies.

Diving in to OpenTelemetry data with our new Trace and Logs Explorer

The team at SigNoz would like to share recent developments released this month that greatly enhance the ability to dynamically query your trace and log data. With these tools anyone can explore complex OpenTelemetry data and gain insight into their stack.
Measuring the time between spans in an OpenTelemetry trace with a Clickhouse query

In a recent conversation on our SigNoz community Slack, a user shared their query that asks a deceptively simple question: what is the average time between two spans in a trace? The usefulness of this answer is evident if you think about how often the total trace time does not highlight the time you care about most. This could mean any number of things: that the total trace time of handling a web request might include lots of spans after a satisfying response was sent to the user.

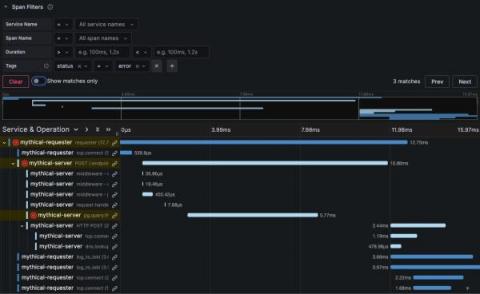
What's new in distributed trace visualization in Grafana

At Grafana Labs, we are constantly improving our feature set, and tracing is no different. Traces are often overshadowed by logs and metrics, but they’re a pillar of observability for a reason. Used correctly, organizations that can quickly and successfully follow a chain of events through a system gain a more holistic view of their systems and are better equipped to find and fix issues faster.

Custom Java Instrumentation with OpenTelemetry

Discover how to gain unparalleled visibility and traceability into your applications with our latest video! As an expansion of our blog post, this tutorial dives into the world of Site Reliability Engineering and IT Operations, guiding you step-by-step through the process of implementing a plugin for the OpenTelemetry Java Agent using its Extensions framework.

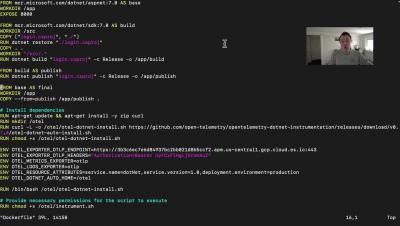
Elastic APM - Automatic .NET Instrumentation with OpenTelemetry

Check out this YouTube video on Elastic Application Performance Monitoring (APM) and its integration with OpenTelemetry for.NET! In this informative and practical tutorial, we delve into the world of APM and demonstrate how to effectively instrument your.NET applications using OpenTelemetry with Elastic APM. Additional Resources: Connect with us on social media.

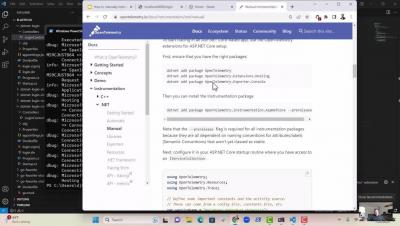
How to Manually Instrument .NET Applications with OpenTelemetry

Welcome to our deep-dive tutorial on manually instrumenting.NET applications with OpenTelemetry! In this comprehensive guide, we walk you through the process of adding OpenTelemetry to your.NET applications to help you better understand and optimize their performance. Whether you're an experienced.NET developer or just getting started, you'll find actionable insights and tips to improve your application monitoring and tracing capabilities.

7 OpenTelemetry Metrics to Track for Better Visibility

In today’s rapidly evolving software landscape, ensuring observability is crucial for building robust and reliable applications. One of the critical components of observability is metrics, which provide valuable insights into the performance and behavior of our systems. OpenTelemetry, an open-source observability framework, offers a standardized approach to capturing, exporting, and analyzing metrics. This blog post explores seven OpenTelemetry metrics for tracking better visibility.

Kubernetes Troubleshooting Reimagined: Operators and Auto-Tracing

Kubernetes operators help to simplify, streamline, and automate application tasks beyond the conventional Kubernetes offerings. In this webinar, AWS Developer Advocate for Kubernetes, Lukonde Mwila, will delve into the remarkable capabilities of Kubernetes operators and how to leverage them in your applications. You’ll also learn how Lumigo built a Kubernetes operator for seamless distributed tracing leveraging OpenTelemetry. We will also demonstrate how our operator transforms complex processes into a single command, promising an unmatched user experience and exceptional app health insights.