Operations | Monitoring | ITSM | DevOps | Cloud

Disk I/O profiling with eBPF

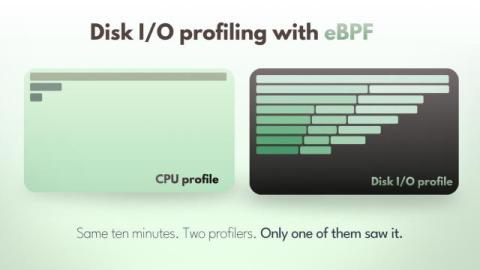
Coroot's node-agent has had an eBPF CPU profiler for a long time. When something burns CPU, you open the flame graph and see which function. When something waits for the disk, you have nothing: the CPU profile is flat, because waiting does not consume CPU. The metrics for disk problems are always the same. Latency on a volume goes up, utilization hits 100%, queries slow down. Every chart agrees the disk is the bottleneck, none of them says what the database was doing while it waited. Flushing pages?
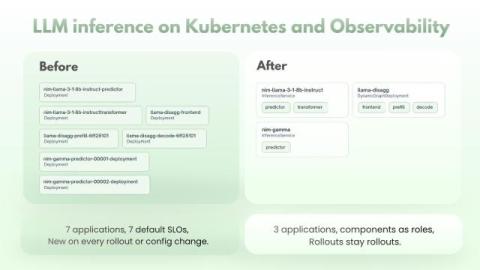
LLM inference on Kubernetes and observability

Running an LLM on Kubernetes is rarely just a Deployment with vLLM in it anymore. A whole layer of frameworks and operators has grown up for it: KServe, NVIDIA Dynamo, Ray Serve, Kthena, llm-d. Each one adds its own custom resource that describes a model deployment, with routing, autoscaling and the split of a model across pods built in, and each one turns that resource into ordinary Kubernetes objects in its own way.

Community Stories: Coroot at the Stanford University Libraries

Coroot was designed to solve the problem of time-consuming root cause analysis. It handles the full observability journey - from collecting telemetry automatically with zero code setup (thanks, eBPF!) to simplifying the role of SREs and DevOps everywhere with instant root cause analysis powered by AI. We also strongly believe that simple observability should be an innovation everyone can afford to benefit from: which is why our software is open source!

Putting Amazon ECS on the map

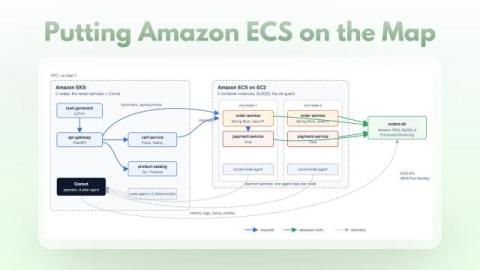
Say "ECS" and most people picture serverless containers: no nodes to manage, and nothing underneath you are allowed to touch. For an eBPF-based agent that is a dead end. There is no host to run on, no privileged containers, no kernel to attach to. But ECS is not always serverless. With the EC2 launch type you bring the nodes and ECS brings the scheduler: task definitions, services, rolling deployments, daemons, placement.

We Ran Minecraft on 4 Raspberry Pis with Kubernetes and Monitored it with Open Source

Why did we do this? Not important: jump to 1:31 to see the Pis. TL;DR: We stuck Minecraft on kubernetes running on 4 Raspberry Pis in a 3D-Printed case, and monitored it with open source observability. Huge thanks to Percona DBA Ivan Zaitsev for putting the demo together for Percona University, Montevideo. Coroot automatically collects and visualizes all your telemetry data: logs, metrics, traces, profiles, and a complete map of your services. With the complete context of eBPF, it can diagnose the exact cause of an incident in seconds, and show you the exact commands to fix it.

Coroot at KCD Argentina

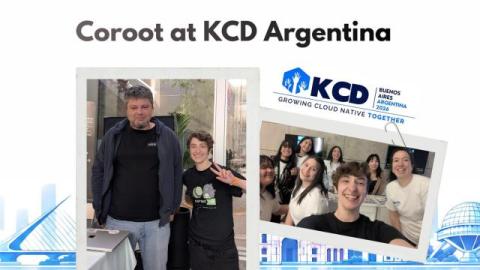
Kubernetes Community Days (KCD) Argentina brought together the vibrant technology communities of Buenos Aires for in-depth technical talks, SRE workshops, and an amazing opportunity to connect with fellow experts in cloud technology. Coroot had a great time participating, and we extend our thanks to all the SREs, DBAs, and DevOps engineers who stopped by the booth to discuss their observability experience.