


|
By Matt LeRay
What happens to transaction posting when statement traffic gets expensive? That’s the question a bank’s platform team actually needs answered before a busy month-end. It’s also a question most load tests can’t ask, because they turn one dial for the whole recording. Statements get heavier, posting gets heavier, and the average latency across both looks fine right up until customers can’t move money.

Sponsored Post
|
By Matt LeRay
We shipped a chaos feature that never caused any chaos. Our mock server has had a fault-injection effect for years with a straightforward job: withhold the response entirely and see whether the caller copes. Last week I audited it against the actual code path. It had never withheld anything. The handler returned early without writing a response. Go's net/http then did what it is designed to do, which is synthesize a 200 OK and flush the recorded body. Every experiment anybody ever ran with that effect handed the application a perfectly good answer, and every one of them passed.

|
By Alan Mon
We made software development faster. Now we need to make validation faster, too. For the last decade we have shifted development left. Testing, security, performance, and CI/CD all moved closer to the developer. Observability mostly did not. It still starts after deployment (we covered the incident side of this in Your Observability Stack Found the Fire), which means the people writing the code rarely have meaningful production behavior to observe while they build.
|
By Ken Ahrens
Before you can answer whether checkout will survive Black Friday, you need a test you can rerun. In this demo, we used a coding agent and the Speedscale skills to record a Node app, mock its downstream API, and run a 30-second load test with 10 virtual users. That’s a small first step in holiday readiness. It gives you a working test and a result to inspect, with time left to fix what you find before a code freeze.
|
By Matt LeRay
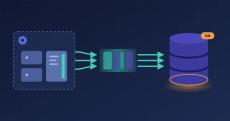
The first PostgreSQL post ran on a laptop: a demo app, a Docker container, and the proxymock CLI. That is the fastest way to see the idea. It is also not where your database problems live. Your real query mix lives in the cluster, where a Java service with a connection pool, an ORM and a schema migration tool sends the statements nobody wrote by hand. This post deploys an open source banking app to Kubernetes and records the queries one of its services sends to PostgreSQL.
|
By Shaun Duncan
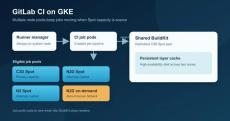
Here at Speedscale, our monorepo has 19 Go projects in CI. Fifteen produce container images for both amd64 and arm64; a few of those need CGO. We also publish cross-compiled CLI binaries for macOS, Linux, and Windows.

|
By Matt LeRay
Before you start, paste this into Claude Code, Cursor, Codex, Gemini CLI, Kiro, or any assistant that can read a URL and run commands: The install-speedscale skill installs proxymock for your operating system and walks you through proxymock init. It stops when you need to complete browser sign-in, keeps your recordings on your machine, and connects the proxymock MCP server so your assistant can run the prompts later in this article.
|
By Matt LeRay
The first number from my local PostgreSQL 16 test was roughly 1,600 statements per second. It looked impressive. It was also the least useful result in the run. The useful part was the workload. It came from queries the demo app had actually sent: the same prepared statements, parameters, reads and writes. A synthetic benchmark tells you how PostgreSQL handles a synthetic workload. It does not tell you whether your migration just broke the UPDATE your app depends on.

|
By Alan Mon
Remember when “going shopping” meant getting in the car? This fall, filling the tank feels like applying for a small loan. U.S. regular gasoline averaged about $4.48 a gallon for the week of September 21, 2026. A round trip to the store starts competing with free shipping. And free shipping never needs a parking spot. That doesn’t tell us how many shoppers will move online this holiday season.

Sponsored Post
|
By Ken Ahrens
Synthetic monitoring has been a critical part of application reliability for years. It gives engineering and operations teams a way to proactively test applications, APIs, and critical customer journeys before users encounter problems. But there is a fundamental limitation with the traditional approach: Someone has to create the tests. As applications become more distributed and customer journeys become more complex, organizations can end up maintaining hundreds or even thousands of synthetic scripts. Every new feature, API, dependency, or change to a customer journey can require another update.
|
By Speedscale
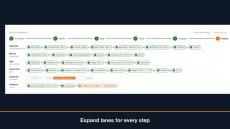
Learn how to track cluster performance in real time using the replay progress panel, which highlights key phases including provision, mock, app, load, analyze, and result. You will also discover how to easily troubleshoot failed runs by expanding component lanes to review specific step reasons and cluster events. Learn more: speedscale.com.
Feature Spotlight: Automatic Testing with Proxymock MCP Skills #aiagents #mcpserver #softwaretesting
|
By Speedscale
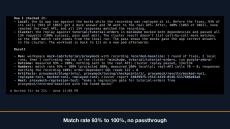
Learn how to integrate your AI coding agent with Speedscale using the MCP server to record, replay, tune mocks, and analyze reports directly within your workspace. Streamline your testing workflow by letting your agent automatically capture traffic, resolve failing responses, and optimize match rates. Learn more: speedscale.com.

|
By Speedscale
Learn how to resolve failed GraphQL session queries by updating expired tokens before replaying your snapshot. This video demonstrates how to find the GraphQL operation, edit variable values by path, and successfully pass replay checks. Learn more: speedscale.com.
Feature Spotlight: Import & Export to Load Testing Tools #api #postman #openapi #loadtesting #devops
|
By Speedscale
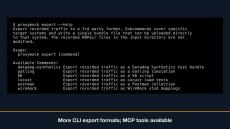
Proxymock allows you to import existing Postman collections, browser HAR files, and OpenAPI specifications to instantly create test requests and mock responses. You can also pull traffic directly from cloud storage buckets, or export your requests into load testing scripts for tools like K6, Gatling, and Locust. Coding agents can even manage these imports and exports using integrated MCP tools. Learn more: speedscale.com.
|
By Speedscale
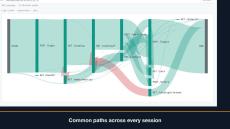
This video provides an overview of using Sessions to group traffic by actor credentials, track individual user journeys chronologically, and analyze request flows. It also covers how to check replay readiness for JWT sessions, replay recorded user journeys at their original pace, verify pass/fail counts, and save or sample specific sessions for easy sharing. Learn more: speedscale.com.

|
By Speedscale
Learn how to analyze a 30-second local load test using AI and Proxymock to track latency and P99 metrics effortlessly.

How to Run a Load Test in 30 Seconds #aiagent #devops #loadtesting #developertools #softwareengineer
|
By Speedscale
Learn more: speedscale.com.


|
By Speedscale
With gas prices driving shoppers online, load test your site with Speedscale to ensure high holiday traffic and slow speeds don't crash your checkout page on Black Friday.

|
By Speedscale
Learn how to easily set up and run automated tests for your Go code using recorded replays, then try running your own test replay today! Read more: speedscale.com.

- October 2026 (19)
- September 2026 (18)
- August 2026 (20)
- July 2026 (24)
- June 2026 (26)
- May 2026 (19)
- April 2026 (27)
- March 2026 (20)
- February 2026 (20)
- January 2026 (30)
- December 2025 (15)
- November 2025 (12)
- October 2025 (14)
- September 2025 (16)
- August 2025 (14)
- July 2025 (8)
- June 2025 (1)
- May 2025 (4)
- April 2025 (16)
- March 2025 (10)
- February 2025 (1)
- January 2025 (7)
- December 2024 (13)
- November 2024 (9)
- October 2024 (24)
- September 2024 (13)
- August 2024 (10)
- July 2024 (4)
- June 2024 (4)
- May 2024 (2)
- April 2024 (5)
- March 2024 (4)
- February 2024 (3)
- January 2024 (1)
- December 2023 (3)
- November 2023 (3)
- October 2023 (4)
- September 2023 (2)
- August 2023 (13)
- July 2023 (2)
- June 2023 (4)
- May 2023 (2)
- April 2023 (2)
- March 2023 (7)
- February 2023 (6)
- January 2023 (4)
- December 2022 (3)
- November 2022 (4)
- October 2022 (2)
- September 2022 (3)
- August 2022 (5)
- July 2022 (5)
- June 2022 (2)
- May 2022 (4)
- April 2022 (4)
- March 2022 (4)
- February 2022 (14)
- January 2022 (6)
- December 2021 (3)
- November 2021 (4)
- October 2021 (5)
- September 2021 (5)
- August 2021 (6)
- July 2021 (5)
- June 2021 (6)
- May 2021 (6)
- April 2021 (2)
- March 2021 (5)
- February 2021 (2)
- January 2021 (2)
- November 2020 (1)
Continuous Resiliency from Speedscale gives you the power of a virtual SRE-bot working inside your automated software release pipeline. Forecast the real-world conditions of every build, and know you’ll hit your SLO’s before you go to production.
Feed Speedscale traffic (or let us listen) and we’ll turn it into traffic snapshots and corresponding mock containers. Insert your own service container in between for a robust sanity check every time you commit. Understand latency, throughput, headroom, and errors -- before you release! The best part? You didn’t have to write any scripts or talk to anyone!
Automated Traffic Replay for Every Stakeholder:
- DevOps / SRE Pros: Understand if your app will break or burn up your error budget before you release.
- Engineering Leads: Let Speedscale use traffic to autogenerate tests and mocks. Introduce Chaos testing and fuzzing.
- Application Executives: Understand regression/performance, increase uptime and velocity with automation.
Before you go to production, run the projection.