Operations | Monitoring | ITSM | DevOps | Cloud

The 7 Hues of DevOps

Purple teams. Blue, green, red, back, canary deploys. Golden signals and red metrics. There are oddly a lot of color adjectives used in DevOps terminology, and Dave and Chris cover them all in this episode. They will talk about the range of deployment strategies for modern applications. The various types of metrics used to monitor them, and the different approaches to understanding how much visibility is good enough.

Going Live: Splunk Operator for Kubernetes 1.0.0

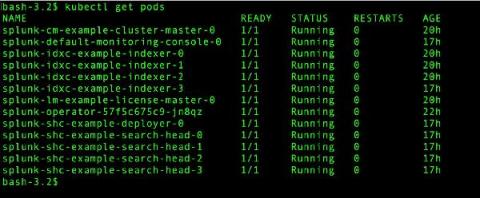
With everything going on in the world, it seems like a lifetime ago that we started talking about the Splunk Operator for Kubernetes, which enables customers to easily deploy, scale, and manage Splunk Enterprise on their choice of cloud environment. During that time, we’ve heard from an increasing number of on-premise and public cloud Bring-Your-Own-License Splunk customers that containerization and Kubernetes are an important part of their current and future deployment plans.

Monitoring Pulse Connect Secure With Splunk (CISA Emergency Directive 21-03)

To immediately see how to find potential vulnerabilities or exploits in your Pulse Connect Secure appliance, skip down to the "Identifying, Monitoring and Hunting with Splunk" section. Otherwise, read on for a quick breakdown of what happened, how to detect it, and MITRE ATT&CK mappings.

Elevate Your Cloud Security Posture with Splunk and Google Cloud

It’s more critical than ever to secure your company data and protect your workloads in the cloud. This blog post is a roundup of the latest technical resources and product capabilities by both Google Cloud and Splunk to enhance your threat prevention, detection, and response techniques, regardless of where you are in your business-transforming cloud journey.

Up Close Monitoring with SignalFlow

It’s April, and that means it’s Mathematics and Statistic Awareness month. And in our everyday world of monitoring and observability, both play an ever-increasing role in how we keep track of our environments, both our apps and our infrastructure. Our world is no longer about just pinging the server/app to make sure “It’s alive!”.

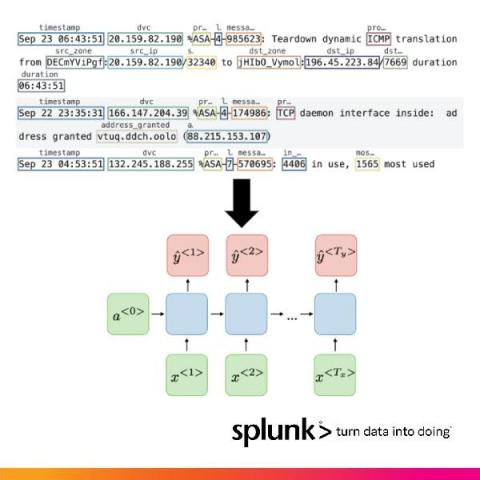
How Splunk Is Parsing Machine Logs With Machine Learning On NVIDIA's Triton and Morpheus

Large amounts of data no longer reside within siloed applications. A global workforce, combined with the growing need for data, is driving an increasingly distributed and complex attack surface that needs to be protected. Sophisticated cyberattacks can easily hide inside this data-centric world, making traditional perimeter-only security models obsolete.

New Splunk Synthetic Monitoring Features Help Integrate Uptime and Performance Across the Entire Splunk Platform

For teams that build or maintain modern applications with their end-users in mind, the acquisition of Rigor means that Splunk now offers the most comprehensive synthetic monitoring solution on the market. Rigor, now Splunk Synthetic Monitoring and Web Optimization, provides best-in-class synthetic monitoring capabilities enabling IT Ops and engineering teams to detect and respond to uptime and performance issues within incident response coordination and throughout software development lifecycles.