Operations | Monitoring | ITSM | DevOps | Cloud

IBM Log Analysis with LogDNA

IBM Log Analysis with LogDNA enables you to quickly find the source of issues and gain deeper insight into application and cloud environment data. Easily aggregate and search application, and server logs within a single platform. Forward logs from IBM Cloud Kubernetes clusters, servers, and applications in as little as three steps. IBM Log Analysis with LogDNA is trusted by teams like IBM Cloud, The Weather Company, and IBM Watson.

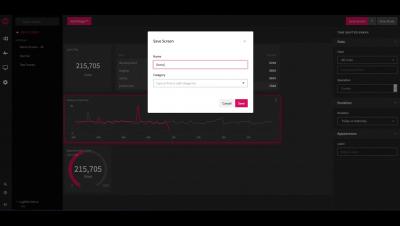
LogDNA | How to Create Screens

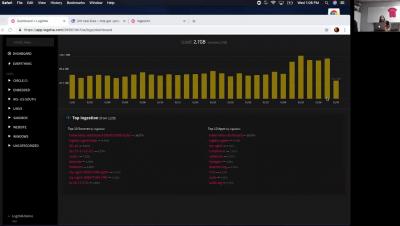
The Screens feature displays a series of widgets to share across an organization. Widgets can display log activity, from the number of logs ingested in the last 4 hours, to a line graph comparing today’s to yesterday’s log ingestion. Control the data displayed by customizing a “Screen” with a combination of different widgets, providing your organization with a snapshot of the system’s activity.

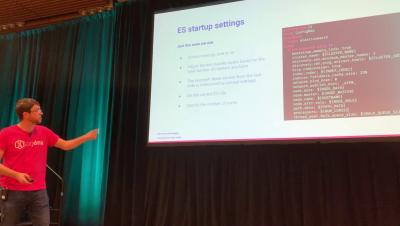
The Future of DevOps Observability: The Evolution of Logging, Monitoring and Metrics

LogDNA is uniquely positioned to have enabled thousands of customers to gain deep insights into their DevOps infrastructure. As the industry has shifted to microservices and Kubernetes we have helped our customers migrate and deploy world-class infrastructure. Based on our experience we see three main pillars when it comes to the future of DevOps: Monitoring, Analytics, and Logging.

How to Start Logging & Invite Team Members in LogDNA's Log Management System

LogDNA is the easiest, fastest log management tool available. Our head of DevOps Ryan Staatz showcases how to get started with LogDNA, ingest logs from numerous platforms - Linux, Kubernetes, Docker, Linux, Syslog, etc., then add team members to join a central organization for centralized log management and analysis.