Operations | Monitoring | ITSM | DevOps | Cloud

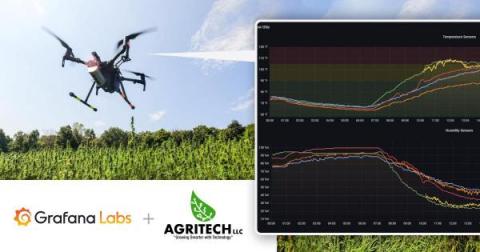
How AgriTech used IoT and Grafana to help industrial hemp farmers hit a new production high

In 2019, Alexander Mann was working in the microchip industry, putting in 12-hour shifts that left no time for him to tend to his large vegetable garden. “I started looking for ways that I could remotely water or check on my plants,” he says. Products that could help him were either too costly for a hobby gardener or required special internet connections, so Mann decided to learn about IoT and create his own setup.
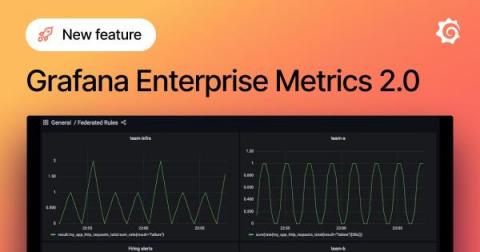
New in Grafana Enterprise Metrics 2.0: Cross-tenant alerting and recording rules

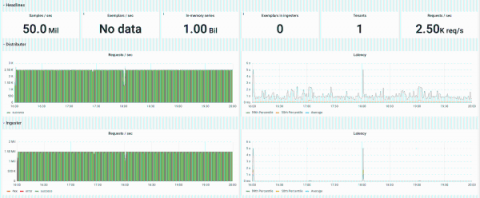
On the heels of launching our new open source TSDB Grafana Mimir, we are excited to introduce Grafana Enterprise Metrics 2.0. GEM 2.0 is built on top of Grafana Mimir 2.0, our easy-to-operate, high-scale database which we’ve shown can handle upwards of 1 billion active series. That means that GEM 2.0 inherits all of the highlights of Mimir, including easy deployment, native multi-tenancy, high availability, durable long-term metrics storage, and exceptional query performance.

New in Grafana Loki 2.5: Faster queries, more log sources, so long S3 rate limits, and more!

I’m very excited to tell you all about the latest Grafana Loki installment, 2.5! A huge amount of work, nearly 500 PRs, has gone into Loki between v2.4 and now. The major themes for this release are improved performance, continuing ease of operations, and more ways to ingest your logs. I usually find myself the most excited about performance improvements, so let’s start there.

How we scaled our new Prometheus TSDB Grafana Mimir to 1 billion active series

Last week, we announced our new open source TSDB, Grafana Mimir, which lets you scale your metrics monitoring to 1 billion active series and beyond. The announcement was greeted with a lot of excitement and interest – and some questions too. Namely: Really, 1 billion? Yes, really!

Grafana Labs announces $240 million Series D round led by GIC and welcomes new investor J.P. Morgan

Today, I’m happy to share that Grafana Labs has closed a $240 million Series D round of investment. This is a major milestone for us that goes well beyond the number of dollars. First, we are grateful to our internal team (affectionately called Grafanistas) and our community of users and customers. Without them, we would not have been given this opportunity.

How to use WebSockets to visualize real-time IoT data in Grafana

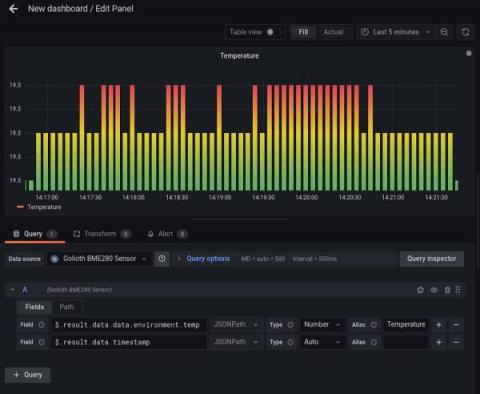
Mike Szczys is a Developer Relations Engineer at Golioth. His deep love of microcontrollers began in the early 2000s, growing from the desire to make more of the BEAM robotics he was building. When he’s not reading data sheets, he’s busy as an orchestra musician in Madison, Wisconsin. At Golioth, a commercial IoT development platform, we love using the power of Grafana to easily visualize data from IoT installations where tens, hundreds, or even thousands of devices are reporting back.

Announcing Grafana Mimir, the most scalable open source TSDB in the world

Today we’re introducing you to Grafana Mimir, the most scalable, most performant open source time series database in the world. Mimir allows you to scale to 1 billion metrics and beyond, with simplified deployment, high availability, multi-tenancy, durable storage, and blazing fast query performance that is up to 40x faster than Cortex. There’s supposed to be a video here, but for some reason there isn’t. Either we entered the id wrong (oops!), or Vimeo is down.

Video: Top 3 features of the New Relic data source plugin for Grafana Enterprise

Grafana Labs and New Relic have a long history of working together to drive cross-functionality so joint customers can benefit from using Grafana and New Relic together. The New Relic data source plugin for Grafana — which is available to users with a Grafana Cloud account or with a Grafana Enterprise license — is no exception. In this quick tutorial video, we’ll not only show you how easy it is to configure the New Relic data source plugin in Grafana.

Full trace retention search comes to Grafana Cloud

This week we have turned on full trace retention search (beta) in Grafana Cloud Traces. This feature was also introduced in the recent release of Grafana Tempo v1.3. Previously, if you brought up your Grafana Cloud Traces data source, you were greeted with this message: This message simply warned the user that the Grafana Tempo search was calibrated for recent traces only, regardless of the selected time window.