Join us for this part 3 of the Getting Started with Splunk Coffee Break This short webinar covers SPL Syntax & Types of Commands. It is part 3 in a series of 5 coffee breaks.
Join us for this part 4 of the Getting Started with Splunk Coffee Break This short webinar covers Splunk Knowledge Objects & Splunkbase. It is part 4 in a series of 5 coffee breaks.
Join us for this part 5 of the Getting Started with Splunk Coffee Break This short webinar covers Popular SPL Commands - stats, timechart, eval. It is part 5 in a series of 5 coffee breaks.
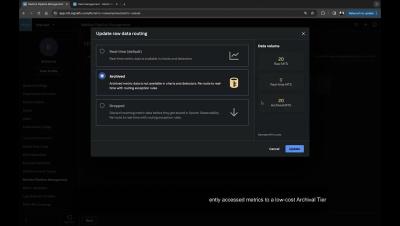
Find out how you can better control your monitoring costs and metrics data volume with the new "Archived Metrics" tier, available in Splunk's Metrics Pipeline Management.
Join us for part 1 of the Getting Started with Splunk Coffee Break This short webinar covers the Importance of Machine Data. It is part 1 in a series of 5 coffee breaks.
How do you become digitally resilient as an organisation? Hear from Maria Nyström, Regional Sales Manager at Splunk Sweden, about how Splunk is helping enterprises get full traceability in their environment. Splunk customers can trace any issue for any user and follow that to the application backend, the specific microservice and the infrastructure it runs on.
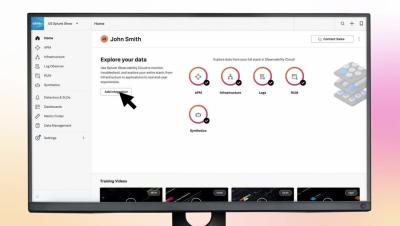
This video walks you through the highlights of phase 1, including deploying the OpenTelemetry Collector, viewing default dashboards, and managing built-in detectors. Enjoy!".
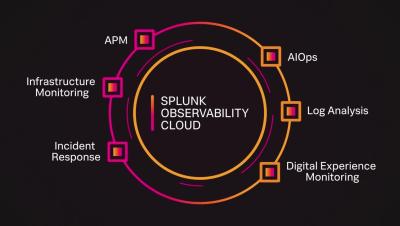
Splunk Observability is built for scale at an enterprise level. You can bring in vast amounts of data in real-time, at a one-second resolution and without the need for sampling.