

Operations | Monitoring | ITSM | DevOps | Cloud

When you have a question, not a dashboard to build: the Metrics explorer and recording rule templates

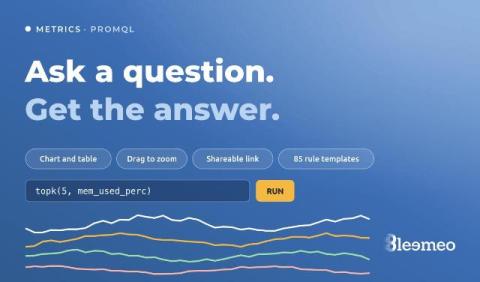
Dashboards answer the questions you knew you would ask. The other kind — “is it only this server, or all of them?”, “since when?”, “what does memory look like on the ones that restarted?” — used to start with creating a dashboard, adding a widget, picking a metric, and deleting the whole thing afterwards. Bleemeo now has a page for those questions. It is called Metrics: you write a PromQL query, run it, and look at the answer.

Azure in Bleemeo: your subscription next to your servers, with one read-only role

Most teams that run on Azure do not run only on Azure. There is a database on a VM nobody wants to move, a Kubernetes cluster somewhere else, a few servers in a rack, and a monitoring setup that grew around all of it. Azure Monitor sees the Azure part very well and nothing else, so the picture of an incident ends up split across two consoles, two alerting configurations and two sets of dashboards. Bleemeo now connects to Azure the same way it already connects to AWS.