Operations | Monitoring | ITSM | DevOps | Cloud

How Grafana Labs switched to Karpenter to reduce costs and complexities in Amazon EKS

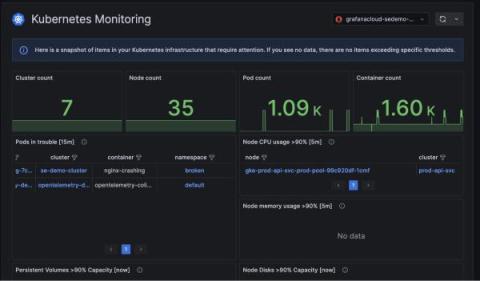
At Grafana Labs we meet our users where they are. We run our services in every major cloud provider, so they can have what they need, where they need it. But of course, different providers offer different services — and different challenges. When we first landed on AWS in 2022 and began using Amazon Elastic Kubernetes Service (Amazon EKS), we went with Cluster Autoscaler (CA) as our autoscaling tool of choice.
Resolve issues faster with Grafana Cloud Application Observability

Grafana Cloud Application Observability provides an out-of-the box experience to monitor application performance and minimize MTTR. With its native support of the open standards OpenTelemetry and Prometheus, Application Observability unifies signals across the full stack, accelerating root cause analysis while removing proprietary formats and vendor lock-in. Watch this demo of how to use Application Observability in Grafana Cloud.

Grafana panel titles: Why we changed from center to left-aligned

As Grafana evolved over the years, so did our panel headers. In our quest for improvement, we continually added design options that created more comprehensive panels, but also an increasingly complex interface. It was a process of continual adaptation without a roadmap — which, though well-intentioned, began to result in unforeseen challenges.

Saga Design System: shaping the future of user experiences at Grafana Labs

At Grafana Labs, we want to empower our fellow Grafanistas and the community to get the most out of the Grafana LGTM Stack (Loki for logs, Grafana for visualization, Tempo for traces, and Mimir for metrics). As part of this effort, we recently launched a new Grafana developer portal. And now, we’re pleased to announce the launch of the Saga Design System, which establishes a shared visual language for all of Grafana Labs’ offerings.

How we upgraded to MySQL 8 in Grafana Cloud

Starting around June this year, we upgraded our Grafana databases in Grafana Cloud from MySQL 5.7 to MySQL 8, due to MySQL 5.7 reaching end-of-life in October. This project involved tens of thousands of customer databases across dozens of MySQL database servers, multiple cloud providers, and many Kubernetes clusters.

Combining frontend and backend performance with John Hill (Grafana Office Hours #18)

In this episode of Grafana Office Hours, Developer Advocates Marie Cruz and Nicole van der Hoeven speak with John Hill, a Web UI Test Engineer and Grafana k6 champion, to talk about how the Grafana and k6 ecosystems can be used to ensure performance in mission-critical applications like NASA’s Open MCT.

Monitor your OpenAI usage with Grafana Cloud

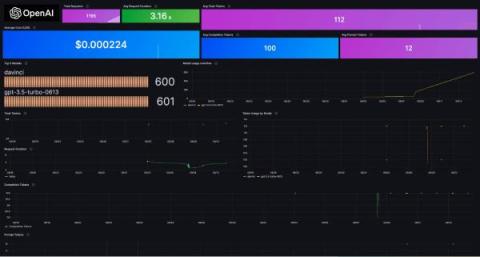
In the ever-changing field of artificial intelligence, OpenAI is consistently seen as a leader in innovation. Its AI models, starting with GPT-3 and now with GPT-4, are already used extensively in software development and content creation, and they’re expected to usher in entire sets of new systems in the future.

What is Observability? Grafana for Beginners Ep. 1

When you are getting started with observability, the jargon and concepts used to explain observability may go straight over your head. Let’s take out the complexity and talk about observability in the simplest terms possible. Join Lisa Jung, a senior developer advocate at Grafana, to get your learning on with the Grafana for Beginners series. You will learn about concepts such as observability and DevOps and how Grafana can be used to observe your system as a part of your DevOps practice.

Grafana Tempo 2.3 release: faster trace queries, TraceQL upgrades

Grafana Tempo 2.3 has been unleashed upon the world, bringing with it the latest iteration of the vParquet backend! Tempo 2.3 has a little bit of everything, but the headline item here is vParquet3 and new features that improve search speeds. Watch the video above for all the details, or continue reading to get a quick overview of the latest updates in Tempo. If you’re looking for something more in-depth, don’t hesitate to jump into the changelog or our Grafana Tempo 2.3 release notes.