Operations | Monitoring | ITSM | DevOps | Cloud

Announcing Application Observability in Grafana Cloud, with native support for OpenTelemetry and Prometheus

The Grafana LGTM Stack (Loki for logs, Grafana for visualization, Tempo for traces, and Mimir for metrics) offers the freedom and flexibility for monitoring application performance. But we’ve also heard from many of our users and customers that you need a solution that makes it easier and faster to get started with application monitoring.

ObservabilityCON 2023 - Opening Keynote (Live)

👋 Coming to you live from London, Grafana ObservabilityCON 2023's keynote introduces the latest developments in the open and composable LGTM (Loki, Grafana, Tempo, Mimir) observability stack AND many exciting announcements! Our keynote features CEO/Co-founder Raj Dutt, CTO Tom Wilkie, and members of the Grafana Labs engineering team.

Managing observability spend with Grafana Cloud's Cost Management Hub

Learn how Grafana Cloud helps analyze, manage and optimize observability spend from a central location called the cost management hub. The move to cloud-native architectures like K8s and Prometheus has caused an unprecedented increase in telemetry data that has resulted in observability bills skyrocketing. With Grafana Cloud and the central cost management hub, you will be able to answer any cost-related question with the tools to inspect, attribute, optimize and monitor your observability spend.

Grafana k6 for Beginners: Why observability needs testing

Having observability and monitoring solutions is a great way to gain insights into your applications' health, behavior, and performance. However, it doesn’t prevent incidents. Observability needs a partner, and this is where Grafana k6 can help you! In this video, Marie Cruz, a Developer Advocate at Grafana Labs, explores what Grafana k6 is, why it's the missing puzzle piece in your Grafana stack, and how to get started.

Load testing on Kubernetes with k6 Private Load Zones (Grafana Office Hours #19)

This week, we're talking about how you can do load testing on Kubernetes with k6 Private Load Zones, a new feature on Grafana Cloud k6 that leverages the k6 Kubernetes operator to allow you to run distributed load tests against applications behind a firewall. Here to discuss this new feature are Senior Software Engineer Olha Yevtushenko, Product Manager Daniel González Lopes, Developer Advocate Paul Balogh, and Senior Developer Advocate Nicole van der Hoeven.

How Grafana Labs switched to Karpenter to reduce costs and complexities in Amazon EKS

At Grafana Labs we meet our users where they are. We run our services in every major cloud provider, so they can have what they need, where they need it. But of course, different providers offer different services — and different challenges. When we first landed on AWS in 2022 and began using Amazon Elastic Kubernetes Service (Amazon EKS), we went with Cluster Autoscaler (CA) as our autoscaling tool of choice.

Resolve issues faster with Grafana Cloud Application Observability

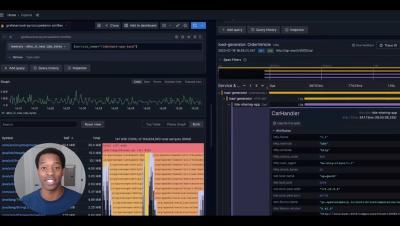
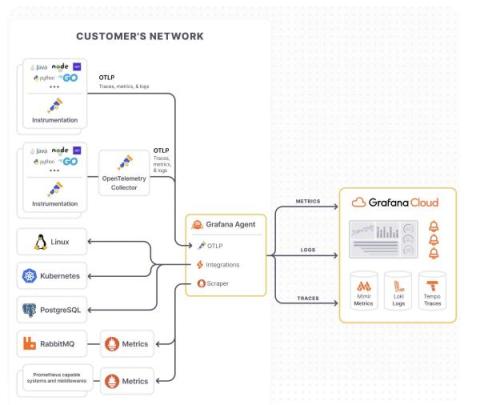
Grafana Cloud Application Observability provides an out-of-the box experience to monitor application performance and minimize MTTR. With its native support of the open standards OpenTelemetry and Prometheus, Application Observability unifies signals across the full stack, accelerating root cause analysis while removing proprietary formats and vendor lock-in. Watch this demo of how to use Application Observability in Grafana Cloud.

Zero-code application observability with Grafana Beyla and eBPF: demo

The eBPF-based OSS auto-instrumentation tool Grafana Beyla makes it easier to get started with application observability. Beyla provides RED (Rate, Errors, Duration) metrics through OpenTelemetry or Prometheus for your existing web services, whichever language they are written in. You don’t need to change any line of application code or configuration; you only need to deploy the Beyla in the same host as the service that you want to monitor. Collecting monitoring data with the eBPF autoinstrument tool has very low overhead, and allows you to capture data about your runtime, which is impossible with manual code instrumentation. Watch this in-depth demo of how to use Grafana Beyla to get started with application observability.