Operations | Monitoring | ITSM | DevOps | Cloud

Blog

Black Box Machine Learning Ate My Homework

If you’re part of a large enterprise, you’re probably in the throes of digital transformation. If you’re in IT, you’re supporting your business by rolling out new services and apps weekly (or even daily). Meanwhile, your users expect 24×7 availability and performance. So your IT operations team is having to sift through ever-increasing data pouring out of myriad specialized and fragmented monitoring tools, hybrid clouds, legacy systems and virtual infrastructure.

Keyword rank tracking - how to and tools

So you’ve managed to create a truly engaging website with the right content and media and you’re promoting it through the proper channels. But sadly, even after making all the “seemingly” necessary efforts your website isn’t getting the attention it should. Well, have you checked if you’re making the right SEO efforts?

Air Quality Sensors and IoT Systems Monitoring

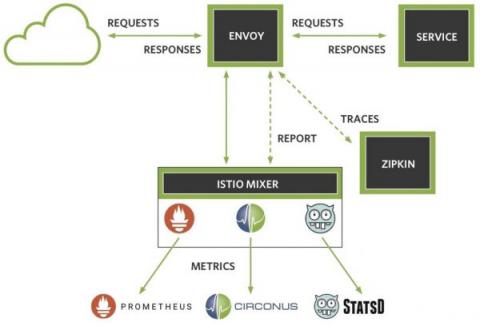
Operating containerized infrastructure brings with it a new set of challenges. You need to instrument your containers, evaluate your API endpoint performance, and identify bad actors within your infrastructure. The Istio service mesh enables instrumentation of APIs without code change and provides service latencies for free. But how do you make sense all that data? With math, that’s how.

The AWS spend of a SaaS small business

In the first 30 days after moving Cronitor to AWS in January, 2015 we collected $535 in MRR and paid $64.47 for hosting, data transfer and a domain name. In the time since we’ve continued to increase our footprint, level-up instances and add more managed services. Despite the AWS reputation as an expensive foot-gun we’ve improved availability while keeping our bill consistently close to 12.5% of revenue. Here’s a look.

Five worthy reads: Does your security operations center really make you immune to cyberattacks?

Many enterprises are at the brink of digital transformation, which entails adopting new technologies that process a sea of both personal and enterprise-level data. Despite a surging number of innovations to prevent evolving cyber threats from hijacking that data, the sheer number of successful, high-profile data breaches and attacks recently highlight the insufficient security practices of organizations around the globe.

timeShift(GrafanaBuzz, 1w) Issue 48

We were in Portland this week attending Monitorama - one of our favorite annual conferences. We got the chance to catch up with old friends, make some new ones, and be part of an amazing community of passionate data and monitoring aficionados. Looking forward to Monitorama AMS in September! Also this week we released Grafana v5.2.0-beta1 and… Elasticsearch alerting has arrived! Download it today and let us know what you think. Check out the specifics on the beta release below.

The AppD Approach: Monitoring Kubernetes Events

Just recently we launched AppDynamics for Kubernetes, giving enterprises end-to-end, unified visibility into their entire Kubernetes stack and Kubernetes-orchestrated applications for both on-prem and public cloud environments. Our industry-leading APM provides visibility into Kubernetes by leveraging labels such as Namespace, Pod or ReplicaSet. And AppDynamics customers can organize, group, query or filter Kubernetes objects or performance metrics based on labels.

Community Plan Improvements & SMS Cost Reduction

StatusCake has always valued it’s community user base; It’s always been our view that if we can support companies at their earliest stages then down the line when they need more advanced monitoring then they know and understand our feature rich product; While other website monitoring platforms are doing more and more to restrict what their free users get, we’ve been looking at what more we can provide and with that in mind have made some improvements to the community plan.

Instrument Your Ruby App In Minutes with the Honeycomb Beeline for Ruby

Meet the Honeycomb Beeline for Ruby. Like our Beelines for Go and Node, it understands the common packages you’re using and automatically instruments them to send useful events to Honeycomb. Then once you’ve got a chance to explore your app’s behavior, you can add custom fields specific to your app with just one line of code.