Operations | Monitoring | ITSM | DevOps | Cloud

Logging

The latest News and Information on Log Management, Log Analytics and related technologies.

Surface and Confirm Buggy Patterns in Your Logs Without Slow Search

Incidents happen. What matters is how they’re handled. Most organizations have a strategy in place that starts with log searches—and logs/log searching are great, but log searching is also incredibly time consuming. Today, the goal is to get safer software out the door faster, and that means issues need to be discovered and resolved in the most efficient way possible.

Maximizing Value and Minimizing Costs: Insights and Next Steps for Effective Tool Deployment

Cribl’s Ed Bailey and Optiv’s Randy Lariar talk about what teams should consider once they acquire a new tool. The hard work starts after the purchase. How do you get maximum value and minimize deployment costs from your new solution? Ed and Randy will offer insight and some suggestions for next steps.

Reduce MTTR with Logz.io's Single-Pane-of-Glass Observability Data Analytics

Observability data provides the insights engineers need to make sense of increasingly complex cloud environments so they can improve the health, performance, and user experience of their systems. These insights can quickly answer business-critical questions like, “what is causing this latency in my front end?” Or, “why is my checkout service returning errors?” Observability is about accessing the right information at the right time to quickly answer these kinds of questions.

Easily analyze AWS VPC Flow Logs with Elastic Observability

Elastic Observability provides a full-stack observability solution, by supporting metrics, traces, and logs for applications and infrastructure. In a previous blog, I showed you how to monitor your AWS infrastructure running a three-tier application. Specifically we reviewed metrics ingest and analysis on Elastic Observability for EC2, VPC, ELB, and RDS.

Getting started with unified observability for Azure in less than 10 minutes using terraform

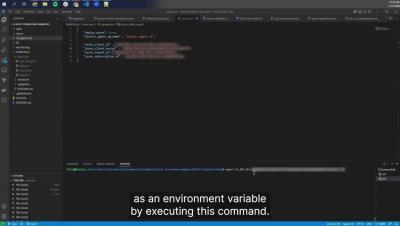
This video provides a step-by-step guide on how to observe Microsoft Azure environments. This will only take about 10 minutes of working time for you to get a fully configured Elastic Cluster that is actively collecting the data of your Azure environment. Chapters: Additional Resources.

Detect data exfiltration activity with Kibana's new integration

Does your organization’s data include sensitive information, like intellectual property or personally identifiable information (PII)? Do you want to protect your data from being stolen and sent (i.e., exfiltrated) to external web services? If the answer to these questions is yes, then Elastic’s Data Exfiltration Detection package can help you identify when critical enterprise data is being stolen and exfiltrated.

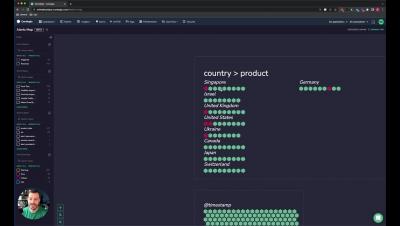
Thousands of Insights at a Glance With Coralogix Alert Map

An effective alerting strategy is the difference between reacting to an outage and stopping it before it starts. That’s why at Coralogix, we’re constantly releasing new features that redefine how alerts are consumed, to enable teams to push their ambitions even further, release with confidence, and tackle issues proactively. Alerts Map is now an indispensable tool for that mission.

FluentD vs FluentBit - Which log collector to choose?

Tools like Fluentbit and Fluentd make log management more efficient by centralizing log data from multiple sources and providing the ability to monitor and analyze it all in one place. Log management is the practice of collecting, storing, analyzing, and monitoring log data from various systems and applications. This log data can provide valuable insights for organizations such as identifying system issues, troubleshooting problems, detecting security threats, and meeting compliance requirements.