Operations | Monitoring | ITSM | DevOps | Cloud

Logging

The latest News and Information on Log Management, Log Analytics and related technologies.

Optimize Application Performance with Code Profiling

When monitoring your application performance or troubleshooting an issue in production, context is key. The more information available, the faster the prevention of or detection of a user impacting issue. Observability tools offer many different features, like code profiling, to help contextualize your data. In this post, I’ll discuss what code profiling is and show an example of how it works.

A Complete Guide to Google's Core Web Vitals and How to Optimize Them

The success of your website lies in how satisfied your users are with it. To help ensure the quality of your user experience, Google uses various signals from a web page. The three Core Web Vitals are some of the most important ones. In this article, I’ll talk about what each Core Web Vital means and how to optimize them to deliver a better user experience.

5 Logstash Alternatives [2023 Review]

When it comes to centralizing logs to Elasticsearch, the first log shipper that comes to mind is Logstash. People hear about it even if it’s not clear what it does: – Bob: I’m looking to aggregate logs – Alice: you mean… like… Logstash? When you get into it, you realize centralizing logs often implies a bunch of things, and Logstash isn’t the only log shipper that fits the bill.

Parsing and enriching log data for troubleshooting in Elastic Observability

In an earlier blog post, Log monitoring and unstructured log data, moving beyond tail -f, we talked about collecting and working with unstructured log data. We learned that it’s very easy to add data to the Elastic Stack. So far the only parsing we did was to extract the timestamp from this data, so older data gets backfilled correctly. We also talked about searching this unstructured data toward the end of the blog.

Custom Preferences in Sematext

Sematext Cloud is a monitoring and log analysis platform that provides tools for monitoring and analyzing the performance and logs of your infrastructure, applications, and services. Custom preferences allow you to customize your UI in the Sematext Cloud. Customize the Default color scheme for your charts and graphs in reports, Change between 12 and 24-hour formats, and change from the light theme to the dark theme. (One of the most requested features from our users)

The Hidden Costs of Logging and What can Developers Do About It?

With the growing adoption of remote and distributed application development including micro-services, cloud-native applications, serverless, and more, it is becoming challenging more than ever before for developers to troubleshoot issues within a reasonable time, and that is a bottleneck. That in a sense contradicts the objectives of Agile and DevOps through fast feedback loops, continuous delivery, quick MTTR (mean time to resolution of defects), etc.

Centralized Logging with Open Source Tools - OpenTelemetry and SigNoz

Modern-day software systems emit millions of log lines per minute. Cloud computing and containerization have made it easy to have distributed systems. Distributed systems emit logs from multiple sources. While developers have always used logs to debug stand-alone applications, centralized logging solves the challenges of modern-day distributed software systems.

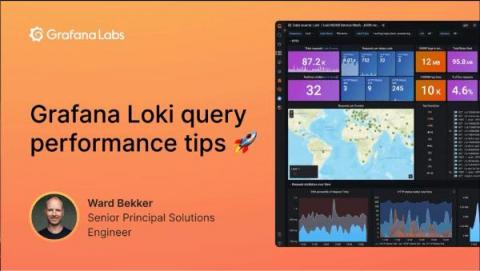
Watch: 5 tips for improving Grafana Loki query performance

Grafana Loki is designed to be cost effective and easy to operate for DevOps and SRE teams, but running queries in Loki can be confusing for those who are new to it. Loki is a horizontally scalable, highly available, multi-tenant log aggregation system inspired by Prometheus. It doesn’t index the content of the logs, but rather a set of labels for each log stream.

Prometheus Roadmap and Latest Updates

We Just celebrated 10 year birthday to Prometheus last month. Prometheus was the second project to join the Cloud Native Computing Foundation after Kubernetes in 2016, and has quickly become the de-facto way to monitor Kubernetes workloads. The plug-and-play experience, just putting Prometheus server and starting to see metrics flowing in tagged with Kubernetes labels, was a compelling offer.