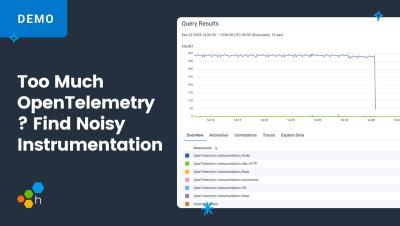
What do you do when OpenTelemetry is sending way more telemetry than you expect? Jessitron walks you through 2 quick ways to check where all that data is coming from.
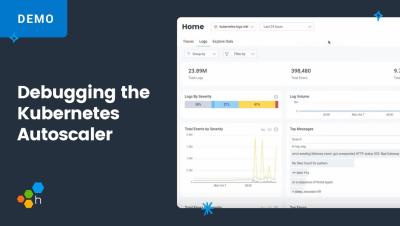
Liz Fong-Jones walks you through how we debugged our Kubernetes Autoscaler with Honeycomb Log Analytics to achieve cost savings with Graviton4 instances. Having great observability is one way Honeycomb saves money.
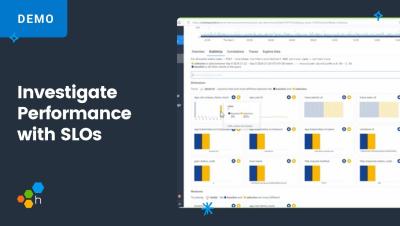
When an alert goes off because a Service Level Objective (SLO) is in danger of violation, it comes with a lot of context about what has been going wrong and for how long. Then Honeycomb gives you tools to explore the where & why. Here, Martin Thwaites walks through an example of diagnosing slower performance. What service is the problem, and under what circumstances?
In this episode, Audrey Herndon, Technical Customer Success Manager at Honeycomb, asks #observability expert Dan Ravenstone at Top Hat, about the all-in-one solution.
In this episode, Victoria Perera Roman, Sr. Technical Customer Success Manager at Honeycomb, asks #observability expert Chris Bertinato, Systems Architect at NS1, why some companies resist adopting Honeycomb.
In this episode of Ask the Experts, Victoria Perera Roman, Sr. Technical Customer Success Manager at Honeycomb, asks Dominic Marino, Principal #software #engineer at Cargurus and #observability expert, why some companies resist adopting Honeycomb.
There's a new way to flip through your data in Honeycomb, released this week! It's super for looking at structured logs. It's called: Explore Data. Get directly at the logs, spans, events, or metrics that power the fast analysis you can do with Honeycomb. See all the fields, the whole variety of values — now ordered by timestamp, with pagination. Modify your query and graphs right from the data table. It's all connected!
See how Honeycomb gives you quick insight into web site performance, including Honeycomb gives you the metrics you need to see, and all the context you need to improve them.