Operations | Monitoring | ITSM | DevOps | Cloud

Fleet Monitoring with Netdata

Modern infrastructure doesn't only live in data centers anymore. It's in retail stores, factory floors, vehicles, cell sites, kiosks, and robots, thousands of nodes across hundreds of locations, connected over links you don't control, in places your team can't easily reach. Traditional observability wasn't built for this. Centralizing every metric from every device gets expensive fast, degrades over constrained links, and goes blind exactly when a remote node needs attention most. In this webinar, we'll show how Netdata inverts the model by putting intelligence at the edge.
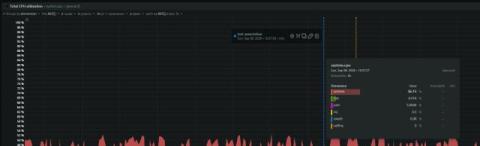
Chart Annotations: Pin the Deploy, the Incident, or the Config Change Right on the Chart

A chart shows you that CPU jumped at 15:57. It doesn’t show you that a deploy went out at 15:56. Chart annotations let you pin a note to the exact moment on a chart, and it stays there for everyone in your Space, permanently, the next time anyone looks at that chart.

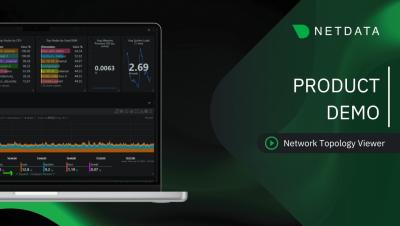
Netdata Network Topology: Live SNMP Discovery & Container Connection Maps

Netdata now builds live network topology maps directly in the agent: no scheduled scans, no stale picture the next morning. In this walkthrough, we cover both sides of the new Topology view: Network device discovery (SNMP): Container & process network connections.

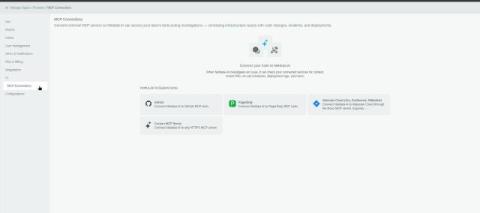
Introducing MCP Connections: Netdata AI Now Reads From the Tools You Already Run

Netdata AI can now connect outward to the tools your team already runs, like GitHub, PagerDuty, Atlassian, or any custom MCP server, and read from them during an investigation. We call this MCP Connections. It’s the missing piece in the middle of every root-cause investigation: the alert tells you what changed, but the why is usually somewhere else entirely.