Operations | Monitoring | ITSM | DevOps | Cloud

Blog

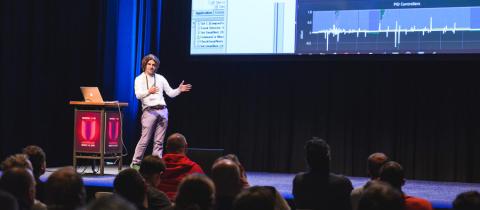
GrafanaCon Recap: Running a Power Plant with Grafana

A water and energy innovation company founded in 2005, Natel Energy builds hydropower turbines and designs resilient and distributed hydropower systems. In his talk at GrafanaCon EU, Natel Developer Ryan McKinley gave us a fascinating look at how the company is using Grafana to help run these next-generation power plants.

How to connect Stackdriver to external monitoring

Google Stackdriver lets you track your cloud-powered applications with monitoring, logging and diagnostics. Using Stackdriver to monitor Google Cloud Platform (GCP) or Amazon Web Services (AWS) projects has many advantages—you get detailed performance data and can set up tailored alerts. However, we know from our customers that many businesses are bridging cloud and on-premises environments.

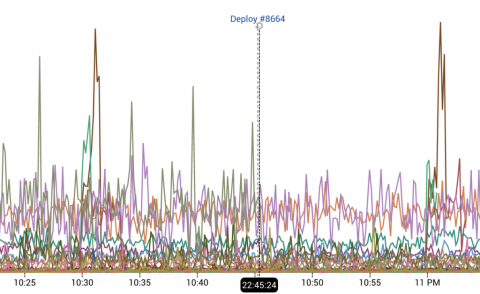
Use New Range Markers to Show The Duration of a State Change

In our world of distributed systems, state changes to your infrastructure often take some time to propagate. With a few exceptions (for example, feature flags), single point in time changes are rare. Deploys, outages, database migrations, failovers, stress tests; none of these things are instantaneous – all have some duration during which the system is changing.

How to Get Java Code-Level Visibility

The toughest IT performance problems to solve today are the ones where a user complains that their application access is slow. An IT administrator must then figure out the cause of the problem: is it the browser, the network, the server, the storage, the cloud infrastructure on which the application is hosted, or the application code?

Fishing for Log Events with Graylog Sidecar

Getting the right information at the right time can be a difficult task in large corporate IT infrastructures. Whether you are dealing with a security issue or an operational outage, the right data is key to prevent further breakdowns. With central log management, security analysts or IT operators have a single place to access server log data. But what happens if the one log file that is urgently needed is not collected by the system?

Four nines and beyond: A guide to high availability infrastructure

We’ve talked about the increasingly-interconnected nature of cloud tools and the domino-goes-crashing-down effect thatcan happen when just one critical service has downtime. Web uptime is more important than ever, and it’s critical that these services we all rely on are up and running as often as possible.

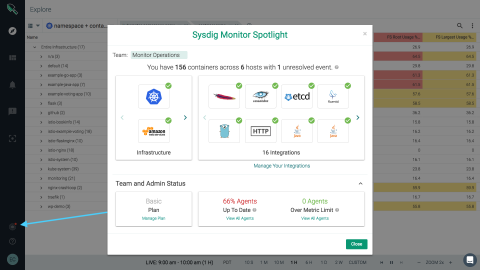
Sysdig Monitor summer 2018 release.

It’s the first day of summer and the perfect opportunity for our summer Sysdig Monitor release round up. For those of you following our progress, we use these blogs to showcase the work we’ve done to add increased functionality, scale, and usability with Sysdig Monitor. What follows are quick descriptions of all the good stuff we’ve made available over the past few months.

A Start to Finish Guide to Docker with Java

Intro to managing and running a containerized Java Spring Boot application. Docker is a platform for packaging, deploying, and running applications in containers. It can run containers on any system that supports the platform: a developer’s laptop, systems on “on-prem,” or in the cloud without modification. Images, the packages Docker uses for applications, are truly cross-platform.