Operations | Monitoring | ITSM | DevOps | Cloud

Monitoring

The latest News and Information on Monitoring for Websites, Applications, APIs, Infrastructure, and other technologies.

Announcing support for .NET Standard 2.0 and ASP.NET Core 2

We are excited to announce our recent support of .NET Standard 2.0 and ASP.NET Core 2 applications for Raygun Crash Reporting. The update is for developers needing to target the .NET Standard 2 APIs. Our new provider targets both .NET Standard 1.6 and .NET Standard 2.0, so it can be used with both .NET Core 1 and .NET Core 2 applications. At the time of writing, it is just the .NET Core provider and ASP.NET Core provider that are .NET Core 2 compatible.

Auvik integrates with ConnectWise

Auvik integrates with both the ConnectWise Manage PSA and ConnectWise Automate’s endpoint RMM to give you full visibility and control of a client’s IT environment. With Auvik’s ConnectWise Manage PSA integration you can sync Auvik alerts back and forth with ConnectWise Manage tickets, and sync Auvik network inventory into ConnectWise Manage.

Hyper-V Best Practices Analyzer and VirtualMetric - more power for your engineers and infrastructure

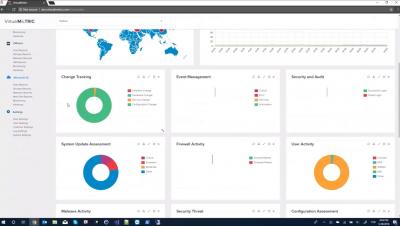
If you are running a Hyper-V and managing a Hyper-V infrastructure, you should be already familiar with the Hyper-V Best Practices Analyzer. Microsoft Hyper-V Best Practices Analyzer is a built-in Windows feature which scans your server configurations for the specific server roles. After the scan is completed, the BPA generate reports that identify the existing best practice violations.

Air Quality Sensors and IoT Systems Monitoring

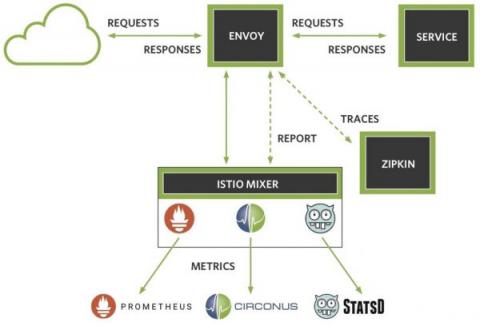
Operating containerized infrastructure brings with it a new set of challenges. You need to instrument your containers, evaluate your API endpoint performance, and identify bad actors within your infrastructure. The Istio service mesh enables instrumentation of APIs without code change and provides service latencies for free. But how do you make sense all that data? With math, that’s how.

The AppD Approach: Monitoring Kubernetes Events

Just recently we launched AppDynamics for Kubernetes, giving enterprises end-to-end, unified visibility into their entire Kubernetes stack and Kubernetes-orchestrated applications for both on-prem and public cloud environments. Our industry-leading APM provides visibility into Kubernetes by leveraging labels such as Namespace, Pod or ReplicaSet. And AppDynamics customers can organize, group, query or filter Kubernetes objects or performance metrics based on labels.

Community Plan Improvements & SMS Cost Reduction

StatusCake has always valued it’s community user base; It’s always been our view that if we can support companies at their earliest stages then down the line when they need more advanced monitoring then they know and understand our feature rich product; While other website monitoring platforms are doing more and more to restrict what their free users get, we’ve been looking at what more we can provide and with that in mind have made some improvements to the community plan.

What is MTTR? How to measure and improve your Mean Time to Recovery

Complex distributed systems run just about every service imaginable. Healthcare systems that monitor patient health, security systems, and financial systems are all mission-critical. Downtime, or lack of availability, loses money and can even put lives at risk. These systems must be monitored. Many measurements are useful to keep systems running with as little downtime as possible. One of those is Mean Time To Recovery. (MTTR.)