
Breaking Down IT Silos with OpManager Plus's Full-stack observability

In today's complex and dynamic IT landscape, a single application relies on dozens of interconnected services, from physical servers to virtual machines, cloud instances, and third-party APIs. When something goes wrong, a traditional monitoring approach that focuses on individual components is no longer enough. This is where full-stack observability becomes critical. It's the ability to gain a holistic, real-time understanding of your entire technology stack, from the user experience all the way down to the underlying network infrastructure. This end-to-end visibility is essential for quickly identifying the root cause of issues, reducing downtime, and ensuring a seamless experience for end-users. Without it, IT teams are left to sift through disparate data manually, leading to a frustrating and time-consuming "war room" scenario every time there's an outage.
This article explores how observability delivers a holistic view of network health and availability, and how OpManager Plus, an AI-driven full-stack observability solution, provides a unified approach to visibility while delivering a competitive edge.
What is full-stack observability?
Full-stack observability is like having a 360° dashboard for your entire IT ecosystem.
Instead of just knowing whether a server is up or down, it lets you see everything from it's applications, networks, infrastructure, databases, and even the user experience, all in a single pane of glass.
Pillars of Observability
Full-stack observability is built upon three core pillars of telemetry data, which, when combined, provide a comprehensive view of a system's health and behavior:
- Metrics: These are quantitative measurements of system performance over time, such as CPU utilization, memory consumption, request rates, and latency. Metrics are ideal for detecting what is wrong with a system.
- Logs: These are detailed, time-stamped records of events that occur within an application or system. Logs provide the granular context needed to understand why something went wrong.
- Traces: Traces follow the journey of a single request as it moves through various services in a distributed system. They are crucial for pinpointing where a performance issue or error originated within a complex application architecture.
OpManager Plus: A Unified Approach to Full-Stack Visibility
ManageEngine's OpManager Plus is a powerful, unified IT operations management solution that delivers full-stack visibility by integrating multiple monitoring capabilities into a single platform. This eliminates the need for multiple, siloed tools and provides a comprehensive view of your entire IT infrastructure.
Here's what OpManager Plus offers you,
Network & Server Monitoring: OpManager Plus is a real-time network performance monitoring solution that enables businesses to proactively track the health, availability, and performance of their networks. With support for over 2,000 metrics across 10,000 devices, it delivers impeccable IT operations monitoring at scale. The platform empowers IT teams to visualize WAN and VoIP paths, pinpoint poor performance of all the network devices in your IT infrastructure, and prevent potential outages before they escalate. Its historical trend graphs aid in accurate capacity planning, while comprehensive monitoring extends across both physical and virtual server infrastructures. With robust server monitoring capabilities, OpManager Plus optimizes the performance of servers and other critical network devices. In addition, built-in network troubleshooting tools help combat critical faults, and dedicated insightful reports allow teams to analyze issues and improve MTTR (mean time to resolve), ensuring smooth and efficient IT operations.
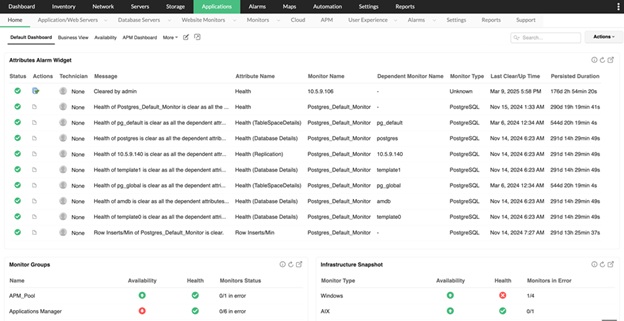
Application Performance Monitoring (APM):
Managing applications in an IT environment often comes with challenges such as performance bottlenecks, security risks, compliance concerns, change management, and scalability. OpManager Plus addresses these complexities through its integration with Applications Manager, enabling businesses to streamline application management with pre-configured monitoring for over 100 applications and server types. This powerful integration offers seamless application discovery and dependency mapping, along with comprehensive visibility into the performance of storage devices and applications across the IT infrastructure. With support for monitoring 130+ on-premises and cloud applications, the solution also enables multi-page workflow measurement, multi-geographic monitoring, and in-depth slowdown analysis to ensure 24/7 website availability and optimal performance.
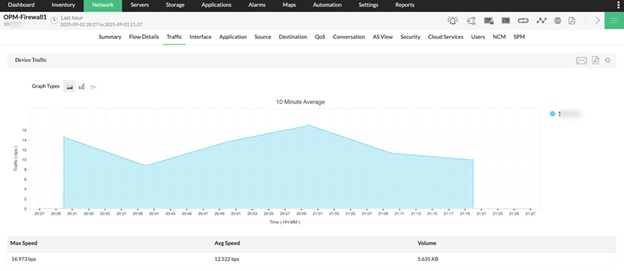
Bandwidth and Traffic Management:
Excessive bandwidth utilization is a common challenge for enterprises of all sizes, as it often results in poor network performance and reduced uptime. To prevent this, IT administrators need to actively monitor real-time network traffic and pinpoint where bandwidth is being misused. OpManager Plus simplifies this process by delivering detailed insights into network traffic and helping identify the root causes of bandwidth drain. Its bandwidth management capabilities include a user-friendly dashboard that provides in-depth visibility into interface-specific traffic, applications, sources, destinations, and conversations, along with advanced forensic reports to accelerate troubleshooting. The solution also offers real-time bandwidth monitoring with support for all major flow technologies, including NetFlow, sFlow, jFlow, IPFIX, NetStream, and AppFlow. Additionally, traffic reports enable IT teams to drill down into application slowdowns and problematic network links, ensuring timely resolutions. Enhanced by its integrated NetFlow Analyzer module, OpManager Plus further strengthens bandwidth management through real-time insights, capacity planning, predictive analysis, trend forecasting, and improved security across enterprise networks.
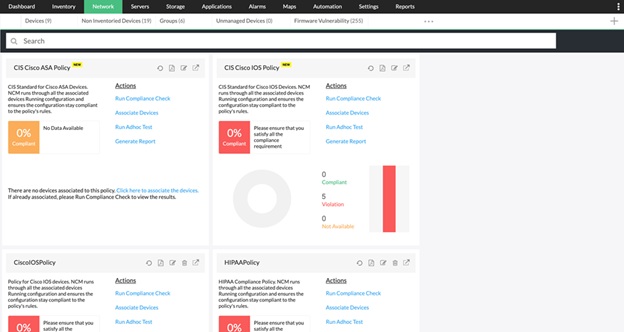
Configuration and Compliance Management:
OpManager Plus provides a comprehensive solution for managing the configuration and compliance of network devices such as switches, routers, and firewalls, offering automation and complete visibility across the entire configuration management lifecycle. It supports configuration management for a wide range of IT infrastructure components from over 200 vendors and enables real-time change management with features like network configuration analysis, user activity tracking, and remote firmware upgrades. The solution ensures seamless and secure change implementation through automated backups, role-based access control, multiple views, and detailed change tracking. Additionally, it helps organizations maintain adherence to key compliance standards such as PCI, SOX, and HIPAA. With its integrated Network Configuration Manager module, OpManager Plus further strengthens security by identifying firmware vulnerabilities and enabling prompt remediation to minimize risks and safeguard network devices.
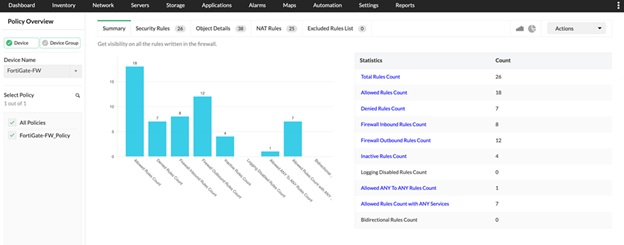
Firewall Management:
OpManager Plus is compatible with a wide range of open-source and commercial firewalls, including Check Point, Cisco, Juniper, Fortinet, and Palo Alto Networks, making it a versatile solution for firewall log and security management. Its capabilities include analyzing firewall logs to detect security threats and traffic patterns, leveraging anomaly detection and rule impact analysis to optimize firewall rule implementation, and providing 24/7 monitoring of rule changes with instant notifications for misconfigurations to maintain strong security. The platform also enhances operational efficiency with automated security audit reports and a dedicated compliance dashboard that offers real-time visibility into an enterprise’s compliance status. Furthermore, OpManager Plus’ firewall module delivers managed firewall services tailored for MSSPs, allowing them to centrally manage multiple firewalls across customer locations through a single OpManager Plus installation.
IP Address and Switch Port Management:
Monitoring and managing IP addresses and switch ports often comes with challenges such as IP duplication, address exhaustion, misconfigurations, and unauthorized access. OpManager Plus helps IT administrators overcome these issues by enabling seamless IP address and switch port management, thereby ensuring a robust and secure infrastructure. With features like dynamic IP address management, monitoring of IP/MAC status and port speeds, and built-in diagnostic tools, the solution streamlines infrastructure management while strengthening overall security. Additionally, OpManager Plus offers more than 30 specialized tools to support various network monitoring tasks, including detecting unauthorized devices, analyzing bandwidth usage, monitoring the availability of critical devices, and safeguarding Cisco configuration files through automated backups.
How OpManager Plus Stands Out from the Competition?
In a crowded market, OpManager Plus distinguishes itself through its comprehensive feature set and focus on intelligent automation and a superior user experience
Intelligent Automation: The platform uses AI-powered features to automate routine tasks, such as device discovery and threshold setting, which reduces the manual workload on IT teams.
Optimized User Experience: With a single, intuitive dashboard, IT professionals can navigate their entire infrastructure without switching between different tools, minimizing context switching and increasing productivity.
Enhanced Security: By integrating firewall management and compliance monitoring, OpManager Plus provides a more secure and resilient network.
Comprehensive Protection: Unlike many single-purpose tools, OpManager Plus offers a full suite of IT operations management features, protecting against a wide range of operational and security risks.
Enhanced Predictive Analytics: Leveraging machine learning, the solution can forecast future resource needs and detect anomalies before they escalate into major problems, enabling a proactive approach to IT management.
Enhanced Visualization: The platform provides advanced visualization tools, such as network topology maps and 3D floor views, to help teams quickly understand device interdependencies and pinpoint the source of issues.
Automated Remediation: It can automatically trigger corrective actions in response to certain alerts, fixing problems without manual intervention and significantly reducing the mean time to resolution (MTTR).
Single Pane of Glass Dashboard: The unified dashboard is arguably its most significant differentiator.It aggregates data from all layers of the IT stack into one central console, providing a holistic and actionable view of the entire IT environment.
Seamless Integrations: OpManager Plus integrates with other IT management tools like ServiceDesk Plus, ServiceNow, etc., and services, allowing it to fit into existing workflows and providing a more robust, cohesive ecosystem.
To summarize, full-stack observability is shaping the future of IT operations, and OpManager Plus is leading the way. By unifying metrics, logs, and traces in a single platform, it helps IT teams move beyond just fixing problems to predicting and preventing them. This proactive approach with OpManager Plus can help organizations deliver seamless digital experiences and achieve the operational excellence needed to drive business success.
Author Bio
Sandhya Saravanan is a Product Marketer at ManageEngine. She creates user-friendly content that drives awareness around advanced network monitoring, observability, and AIOps. Beyond work, she's an art enthusiast and volunteers at a non-governmental organization.