

|
By Chris Cooney
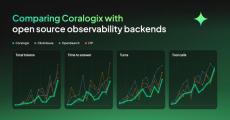
We put the same OpenTelemetry data into four backends, Coralogix, ClickHouse, OpenSearch and a Loki, Tempo and Prometheus stack, then set an agent twelve questions against each one, from counting spans to working out what is wrong in a system it has never seen. Then we forced the agents to continue investigating until they got to the right answer. In this experiment, what separated them was the time, tokens, tool calls and turns it took to get there.
|
By Andre Scott
The Coralogix migrations team has published what it measured. Since 2023 the team has moved more than 75,000 assets across 300+ migrations and onboardings, including a single migration of about 41,000 alerts. The new Migration Benchmarks page holds the figures by source, a calculator for your own migration and the causes of delay that post-migration reviews name most.
|
By Shai Reznik
Your coding agent can debug production issues now. Yes… Not just “help you debug.” Actually run the investigation… FOR YOU! In this new era of agentic development, speed matters. And in the old days (you know… last week or so) we used to investigate production bugs ourselves. Manually. Like humans. But for a lot of incidents, we don’t need to do all of that anymore.
|
By Peter Hammond
With GitOps, you can roll back your cluster with git revert and explain each approved change through a commit log. Routing normal changes through Git and running an in-cluster agent that detects drift from the repository gives infrastructure changes the same review and rollback discipline as application code, and Git preserves their history. This guide covers the four GitOps principles, the pull-based reconciliation workflow, and the tools and practices you need to get started.
|
By Coralogix Team
Coralogix APM has told you which service is behind the latency. From today, the new APM experience tells you what is behind the service: the release, the environment, or the query one layer down. It watches every service you run from the moment it appears, without anyone writing an alert. And everything you see on the screen, your AI agent can use too: in Olly, from the Coralogix CLI, or through MCP in your IDE. A latency chart shows that something got slow.
|
By Coralogix Team
Every page view, click, and session your RUM SDK captures lands in Coralogix as a log event under the cx_rum subsystem — the raw data behind how people actually use your product. You can turn it into a shareable report without writing a single query. Just ask your coding agent. Your agent queries that data through the CX CLI and writes the report for you: describe what you want in plain English, get a formatted report back — without leaving the terminal.
|
By Chris Cooney
Tuning guardrails can take time. To accelerate this, we combined the power of Claude Code, Coralogix Telemetry and the CX CLI, to build a loop that iterates on guardrails. To test our loop, we built a fictional chat interface for an iGaming operator, that took bets, gave odds on markets and more, but with a catch: this agent was not permitted to make predictions about where the market was going. With our goal in place, we got to work designing our loop.
The OpenTelemetry Operator changed how teams approach telemetry collection in Kubernetes. The core appeal of zero-code instrumentation is that you can bring up telemetry inside application containers to collect traces, metrics, and logs without touching your source code or rebuilding your container images. However, if you follow the default OpenTelemetry Operator documentation, you quickly run into a heavy operational prerequisite: the Instrumentation CRD.
|
By Chris Cooney
An agent that only speaks when spoken to is a tool you have to remember to use. Olly has run on a schedule for a while now, working a saved prompt hourly, daily, weekly, or monthly and writing its findings into a chat with its own run history. Those scheduled tasks are now wired into the Coralogix Notification Center, so Olly delivers that output itself, allowing Olly to reach out to Slack or email, out of the box.
|
By Coralogix Team
Coralogix Real User Monitoring has spent years collecting full-fidelity user sessions: every session and event processed in stream, without sampling and without prior indexing, at rest in cloud object storage you own. Today that data does a second job. Product Analytics brings heatmaps, funnels, and pathways to the RUM sessions you already send, with no second SDK to install. One dataset now answers what your users did and why it happened.
|
By Coralogix
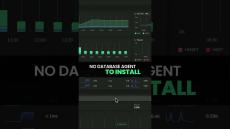
5 things you can do with the new Coralogix APM, no alerts to write and no database agent to install.
|
By Coralogix
Thousands of agent sessions last month. But what did they actually ship? Vendor consoles show you tokens, Coralogix shows you impact, repo by repo, session by session. No vendor lock-in, no data limits.

|
By Coralogix
Do you know how much of your AI agent spend goes to repos your company doesn't even manage? Olly makes it one question away.


|
By Coralogix
Watch the full episode: MCP vs CLI: Does it even make a difference? Live Laugh Logs ep. 3.


|
By Coralogix
Welcome to Episode 4 of Live Laugh Logs, the podcast from the Coralogix Developer Relations team. This week, Chris Cooney joins Annie to share five key DevOps skills that have become even more important in the age of agentic code development, and gives you five key actions you can do today to start levelling up these skills. Subscribe to our channel for more insights into observability and AI.
|
By Coralogix
There are numerous types of logs in AWS, and the more applications and services you run in AWS, the more complex your logging needs are bound to be. Learn how to manage AWS log data that originates from various sources across every layer of the application stack, is varied in format, frequency, and importance.
- October 2026 (7)
- September 2026 (2)
- August 2026 (13)
- July 2026 (11)
- June 2026 (20)
- May 2026 (15)
- April 2026 (14)
- March 2026 (11)
- February 2026 (11)
- January 2026 (3)
- December 2025 (8)
- November 2025 (8)
- October 2025 (3)
- September 2025 (3)
- August 2025 (11)
- July 2025 (10)
- June 2025 (3)
- May 2025 (4)
- March 2025 (4)
- February 2025 (2)
- January 2025 (3)
- December 2024 (1)
- November 2024 (4)
- October 2024 (1)
- September 2024 (5)
- August 2024 (4)
- July 2024 (2)
- June 2024 (4)
- May 2024 (3)
- April 2024 (2)
- March 2024 (4)
- February 2024 (2)
- January 2024 (7)
- December 2023 (5)
- November 2023 (2)
- October 2023 (2)
- September 2023 (9)
- August 2023 (14)
- July 2023 (6)
- June 2023 (9)
- May 2023 (11)
- April 2023 (6)
- March 2023 (10)
- February 2023 (7)
- January 2023 (4)
- December 2022 (4)
- November 2022 (6)
- October 2022 (14)
- September 2022 (6)
- August 2022 (7)
- July 2022 (9)
- June 2022 (10)
- May 2022 (7)
- April 2022 (9)
- March 2022 (11)
- February 2022 (10)
- January 2022 (7)
- December 2021 (9)
- November 2021 (8)
- October 2021 (7)
- September 2021 (7)
- August 2021 (8)
- July 2021 (5)
- June 2021 (6)
- May 2021 (8)
- April 2021 (8)
- March 2021 (14)
- February 2021 (10)
- January 2021 (15)
- December 2020 (16)
- November 2020 (10)
- October 2020 (21)
- September 2020 (14)
- August 2020 (15)
- July 2020 (9)
- June 2020 (11)
- May 2020 (10)
- April 2020 (13)
- March 2020 (8)
- February 2020 (2)
- January 2020 (3)
- December 2019 (1)
- September 2019 (2)
- August 2019 (1)
- June 2019 (2)
- April 2019 (1)
- March 2019 (1)
- January 2019 (1)
- December 2018 (1)
- October 2018 (2)
- August 2018 (1)
- July 2018 (3)
- June 2018 (1)
- May 2018 (1)
- April 2018 (1)
- November 2017 (1)
- September 2017 (1)
Coralogix helps software companies avoid getting lost in their log data by automatically figuring out their production problems:
- Know when your flows break: Coralogix maps your software flows, automatically detects production problems and delivers pinpoint insights.
- Make your Big Data small: Coralogix’s Loggregation automatically clusters your log data back into its original patterns so you can view hours of data in seconds.
- All your information at a glance: Use Coralogix or our hosted Kibana to query your data, view your live log stream, and define your dashboard widgets for maximum control over your data.
Our machine learning powered platform turns your cluttered log data into a meaningful set of templates and flows. View patterns and trends, and gain valuable insights to stay one step ahead at all times!