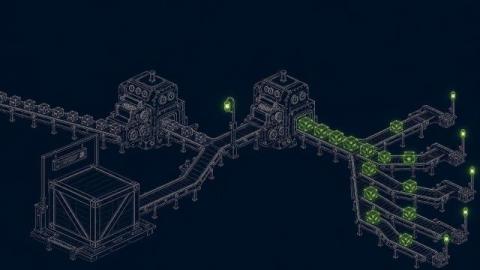
How database indexes work, when to use B-tree vs hash indexes, clustered vs non-clustered indexes, and how to tell if your indexes are actually helping.
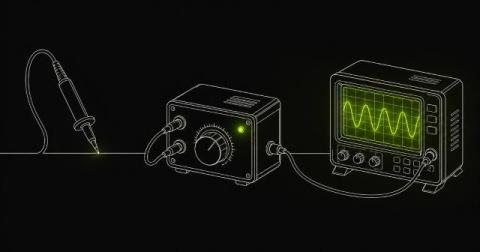
January 2026 Release Here's a dirty secret about observability: most teams find out about outages from their customers. Not from their dashboards. Not from their alerts. From angry tweets and support tickets. The excuse is always the same: "We have metrics! We have dashboards! We even have that AI thing now!" And yet, somehow, your checkout endpoint has been returning 502s for forty-five minutes and you're learning about it from the VP of Sales who just got off a call with your biggest customer.
TL;DR: Prometheus pays cardinality costs at write time (memory, index). ClickHouse pays at query time (aggregation memory). Neither is "better":they fail differently. Design your pipeline knowing which failure mode you're accepting. -- Every month, someone posts "just use ClickHouse for metrics" or "Prometheus can't handle scale." Both statements contain a kernel of truth wrapped in dangerous oversimplification.
When it comes to containerization technologies, Podman and Docker are the two giants that often come up in conversation. Both have revolutionized how we build, deploy, and manage containers, but what sets them apart? In this blog, we'll dive deep into a side-by-side comparison of Podman and Docker. We'll cover everything from architecture to security, performance, and compatibility.
When it comes to monitoring and observability tools, Datadog is often one of the first names that comes to mind. But while Datadog’s features are widely discussed, its pricing often remains a topic of confusion. How much does Datadog cost, and what factors influence your bill? This guide breaks down Datadog pricing to help you better understand its structure, hidden nuances, and whether it’s the right fit for your needs.
High-cardinality metrics are one of those ideas that sound obviously right - until you try to use them in production. In theory, they promise precision. Instead of averages and rollups, you get specificity: per-request, per-userid, per-container, per-feature insights. The kind of detail we all immediately want when something is on fire. And then things start breaking. Not immediately. Not loudly.But quietly.
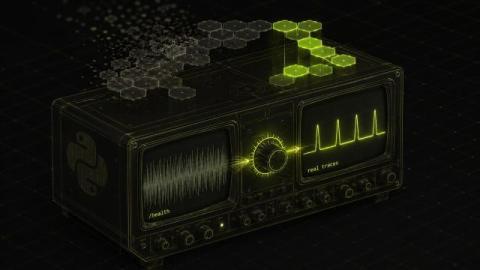
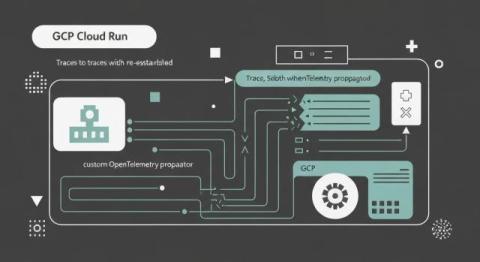
OpenTelemetry is deprecating the Zipkin exporter specification. Zipkin now supports OTLP ingestion natively, so the custom exporter logic in OTel SDKs is no longer necessary.
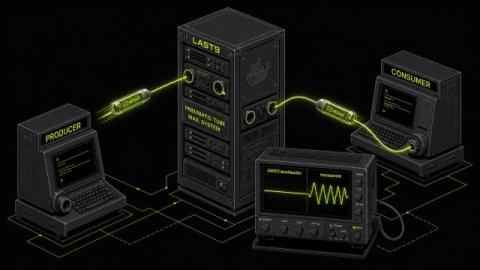
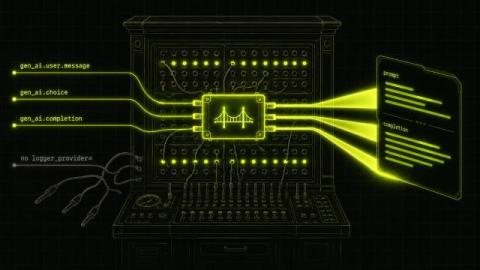
If you're using TrueFoundry to manage your LLM traffic, you can now send those traces directly to Last9 and view them alongside your existing infrastructure telemetry.
Reduce alert noise by 70% through intelligent aggregation, clear ownership boundaries, and filtering metrics that don't map to user-facing issues. Monitoring starts with a straightforward goal: understand your system's health and identify issues before users notice them. You set up metrics, create dashboards, and configure some alerts. At first, it works well. Over time, your stack gets bigger and more complicated. New services get added.
Over the past year, the Governance Committee ran user interviews and surveys with organizations deploying OpenTelemetry at scale. A few patterns came up consistently: Stability levels aren't always obvious. When you install an OTel distribution, some components might be experimental or alpha without clear markers. This makes it harder to evaluate what's production-ready. Instrumentation libraries sometimes wait on semantic conventions.