Operations | Monitoring | ITSM | DevOps | Cloud

Alerting

Custom Alerts Using Prometheus in Rancher

This article is a follow up to Custom Alerts Using Prometheus Queries. In this post, we will also demo installing Prometheus and configuring Alertmanager to send emails when alerts are fired, but in a much simpler way – using Rancher all the way through. We’ll see how easy it is to accomplish this without the dependencies used in previous article.

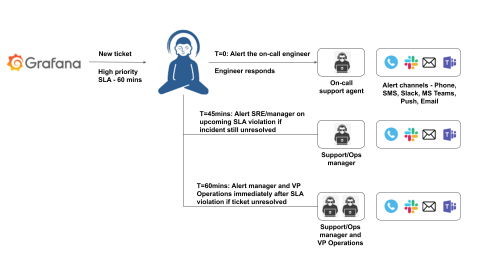
Grafana alerts and incident escalation with Zenduty

Grafana is one of the most popular open-source visualization tools that can be used on top of a variety of different data stores but is most commonly used together with Graphite, InfluxDB, Prometheus, Elasticsearch, Prometheus, AWS CloudWatch, and many others. Reliability engineers use Grafana is its ability to bring together several data sources together in a unified dashboard and increase the observability of your production systems.

Five Ways AIOps Can Transform Your Enterprise

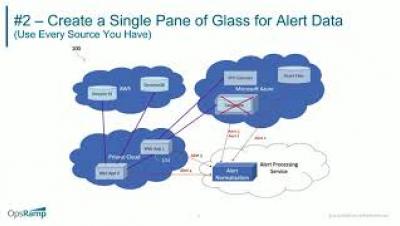
Artificial intelligence for IT operations is a new, emerging technology to help IT operations teams make sense of operational data. But how can it work for you? Join the OpsRamp AIOps experts and learn: How AIOps can help you proactively monitor for disruptions Where AIOps can speed detection and remediation of incidents Which alerts AIOps can automatically reduce from your system How to choose and evaluate an AIOps tool for your organization

What's New: Related Incidents, Business Response, Mobile Status Dashboard, & New Integrations

An always-on world requires a proactive and preventative approach to managing your digital operations. PagerDuty is proud to announce our latest release, which helps streamline remote remediation by providing an at-a-glance overview of your system’s health. While we’re known for on-call management and incident response, PagerDuty does much more, including providing visibility into the business impact of an incident.

Extracting Insights from Metrics with AIOps for Better Observability

In this second installment of this blog series, we’ll discuss the importance of analyzing metrics, and how AIOps helps you with this fundamental pillar of observability. Without proper metrics analysis, you’re left blind to potential outages, or possibly worse — inundated with false positive anomalies, leading to alert fatigue and ultimately business impacts. Automated discovery and analysis can’t be achieved with legacy tools nor will it scale with humans.

Using observability tools to set SLOs for Kubernetes Applications

You deployed a service to your Kubernetes cluster. How do you it is working as expected? In this blog, Gigi Sayfan, author of “Mastering Kubernetes” talks about Kubernetes observability tools like Prometheus, Grafana and Jaeger, how to utilize them to set proper SLOs and make sure the service meets its objectives.