Operations | Monitoring | ITSM | DevOps | Cloud
Logging
The latest News and Information on Log Management, Log Analytics and related technologies.
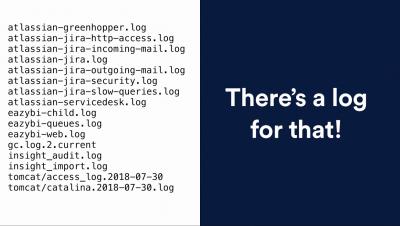
Find the Root Cause - Atlassian Logs and ELK
Preparing for the Elastic Certified Engineer Exam - Get Elasticsearch Certified
Live Tailing Parsed Logs in Logz.io
Last year we introduced Live Tail — the ability to see a live feed of all the logs in your system, in real time, within Kibana. This ability to see a live stream of logs as they are being outputted from the different processes in a monitored environment was a greatly requested feature, and since being introduced we have received some excellent feedback from users that has allowed us to improve the basic functionality of Live Tail.
Logstash Tutorial: A Quick Getting Started Guide
Looking to learn about Logstash as quickly as possible? This article is for you: we’ll install Logstash and push some Apache logs to Elasticsearch in less than 5 minutes.
The Importance of Continuous Intelligence on the Future of Full-Stack System Management
Log Management & Analytics - A Quick Guide to Logging Basics
How to collect, customize, and manage Rails application logs
Logging is an important part of understanding the behavior of your applications. Your logs contain essential records of application operations including database queries, server requests, and errors. With proper logging, you always have comprehensive, context-rich insights into application usage and performance. In this post, we’ll walk through logging options for Rails applications and look at some best practices for creating informative logs.
Collecting and monitoring Rails logs with Datadog
In a previous post, we walked through how you can configure logging for Rails applications, create custom logs, and use Lograge to convert the standard Rails log output into a more digestible JSON format. In this post, we will show how you can forward these application logs to Datadog and keep track of application behavior with faceted log search and analytics, custom processing pipelines, and log-based alerting.


