Operations | Monitoring | ITSM | DevOps | Cloud
Logging
The latest News and Information on Log Management, Log Analytics and related technologies.
Level 2 Certification: Using Sumo Logic - Oct 2018
5 Best Practices for Using Sumo Logic Notebooks for Data Science
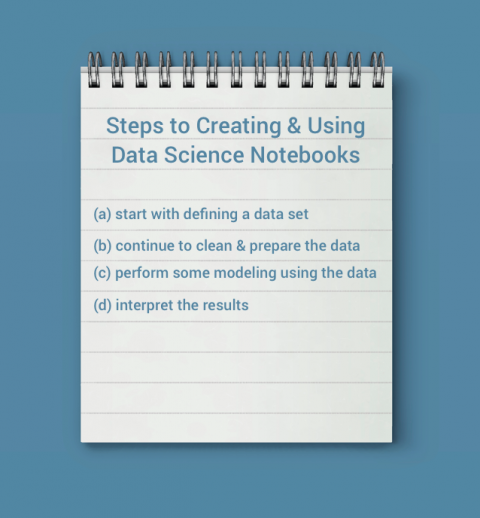
This year, at Sumo Logic’s third annual user conference, Illuminate 2018, we presented Sumo Logic Notebooks as a way to do data science in Sumo Logic. Sumo Logic Notebooks are an experimental feature that integrate Sumo Logic, notebooks and common machine learning frameworks. They are a bold attempt to go beyond what the current Sumo Logic product has to offer and enable a data science workflow leveraging our core platform.
New Age in Windows Log Analysis and Monitoring
Intro to Splunk IT Service Intelligence
How to Monitor Azure Services with Sumo Logic
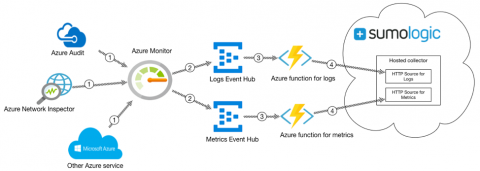
This week at the Microsoft Ignite, we unveiled two new Sumo Logic applications for Microsoft Azure services — Azure SQL Database and Azure Active Directory — and two new native integrations with Azure Monitor and Blob Storage. As a cloud-native company, our goal at Sumo Logic is to give our customers the flexibility to create digital IT and DevOps initiatives that leverage multi-cloud deployments in Amazon Web Services (AWS), Google Cloud Platform (GCP) and Microsoft Azure.
ITOA - make IT simple with XpoLog
ITOA becomes very manageable and simple with XpoLog log management tool. This post will focus on methods the team here at XpoLog uses to manage unstructured IT log data and visualization using smart tagging techniques.
Cloud Complexity Management, a New Need for 2019
Quantifying WordPress Performance Improvements with circonus-logwatch
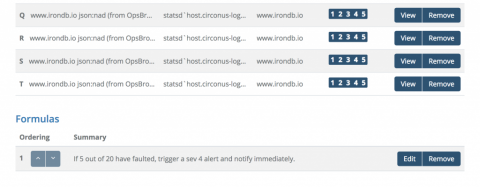
Deriving meaningful insights from third-party logs has always been a difficult yet necessary task. Most analysis occurs after-the-fact, when something has gone wrong. Very few tools allow real-time monitoring of logs, so SREs have become accustomed to backfilling log data into various analysis tools. Postmortem log analysis is the de facto standard, yet should it be? Why shouldn’t you be able to monitor your server logs in real-time?
Honeycomb vs Elastic Stack: It's about priorities
If you’ve been paying attention, you know that although collecting and reviewing metrics and logs is a core part of running a stable and successful service, access to raw events and the ability to search and pivot on any dimension of your production environment, no matter how high-cardinality, is what will help your team debug and troubleshoot new problems and outages more quickly.


