Operations | Monitoring | ITSM | DevOps | Cloud

Latest News

GrafanaCon Recap: The State of TSDB

At GrafanaCon EU, we gathered representatives of the Graphite, Prometheus, InfluxDB, and Timescale projects in the hopes of starting a spirited conversation about the current state of Time Series Databases. They didn’t disappoint! Here are a few highlights from the TSDB panel featuring Erik Nordstrom from Timescale, Dan Cech from Graphite, Paul Dix from InfluxDB, and Tom Wilkie from Prometheus, and moderated by Grafana Labs co-founder and CEO Raj Dutt.

From Keymetrics to PM2 +

5 years. It's been an amazing journey to build Keymetrics and PM2 through the last 5 years. I've started to create PM2 when Node.js was at the beginning of its fame, then Keymetrics was built a year after. I would like to say THANK YOU, to all of you, users, customers, teammates, maintainers, contributors for having made these softwares reach this height.

5 Challenges and Solutions of Migrating to the AWS Cloud

Modern IT environments are far too complex and dynamic for traditional tools. Successful IT organizations have figured out that before, during, and after a migration to AWS, OpsGenie is a critical tool to monitor and alert on concerns for on-premise, hybrid solutions (on-premise with some part in the cloud), or fully in AWS.

Monitoring Flask apps with Datadog

Flask is a Python framework known for its ease of use. It inherits Python’s advantages of extensibility, broad support, and relative simplicity. It’s known as a microframework because it relies on extensions for much of its functionality. Flask avoids constraining the developer to a predetermined database or authentication mechanism, for example, and instead leaves room for choice.

Adopting a SIEM solution, Part 2: What should you consider when choosing a SIEM tool?

In part one of this two-part series, we discussed why organizations should adopt a SIEM solution to ensure network security. In this second part, we’ll be demystifying the critical capabilities of SIEM tools and show you what to consider when picking a solution.

Air Quality Sensors and IoT Systems Monitoring

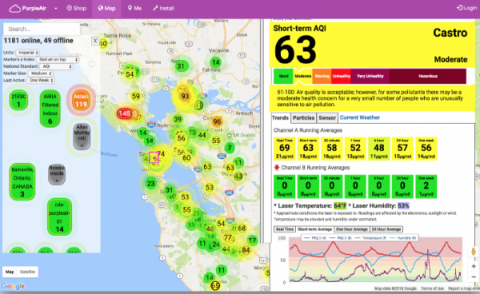
2017 was a bad year for fires in California. The Tubbs Fire in Sonoma County in October destroyed whole neighborhoods and sent toxic smoke south through most of the San Francisco Bay Area. The Air Quality Index (AQI) for parts of that area went up past the unhealthy level (101–150) to the hazardous level (301–500) at certain points during the fire. Once word got out that N99 dust masks were needed to keep the harmful particles out of the lungs, they became a common sight.

Improve the Productivity of Relationship Managers and Financial Advisors with Business iQ

Every job has its mundane administrative tasks, and we all hate them. In the world of wealth management, relationship managers are pressured to serve as many existing customers and prospects as they can with the ultimate goal of increasing the assets under management (AUM)—one of the key metrics used to measure their productivity. Similarly, in the insurance industry, financial advisors are driven to maximize their time with clients.

Instrument Your Python App Automatically With The Honeycomb Beeline for Python

We’ve been on a roll this year with Beelines, our integrations for quick, easy, and automagic instrumentation of your apps. You may have already seen our Node.js, Ruby, and Go beelines – today, we’re excited to announce the release of the Honeycomb Beeline for Python!

Selenium based functional testing & transaction monitoring

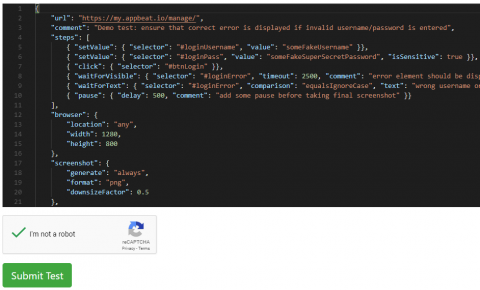
This functionality was frequently requested by our users and now we finally have it - automated synthetic monitoring using real browser! It allows you to periodically simulate user interaction with you web application by entering form fields, submitting forms, clicking links and buttons, etc. For list of currently available browser commands please visit our "Quick reference" section.