


Ahmedabad, India
2010
  |  By Poonam Lalani
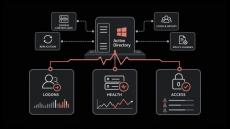
How much of your device inventory could you verify today without opening more than one console? Most IT teams can report what they purchased. Far fewer can say which of those machines are patched, encrypted, running approved software, and still checking in, because that answer spans several systems. Unified endpoint management consolidates those systems into one. Most IT teams inherit that split one platform at a time.
  |  By Poonam Lalani
Why does one branch report unusable voice and video every afternoon while the WAN dashboard at head office shows every site green? Most network teams have fielded that escalation. The device responds, the tunnel status reads up, and application performance is still unacceptable. SD-WAN was built for the distance between a connection that responds and an application that performs.
  |  By Ramya Shah
Your exposure list grows faster than your team can clear it. Security adds new findings every week, and your IT team gets to a fraction of them. Everything left over is a backlog an attacker can walk straight through, and buying another scanner will not shrink it. Most attack surface management programs live inside that gap. Finding exposures got easy. Closing them did not, and a queue nobody has time to work is where the risk quietly builds.
  |  By Poonam Lalani
Does the anomaly you need to catch show up in infrastructure, in security logs, in a data pipeline, or in a revenue figure? If you already know the answer, you probably learned it from an incident. A service degraded quietly, nobody got paged, and the post-mortem showed the signal had been in the data for hours. The thresholds were set correctly, and they still could not separate a busy Tuesday from a failure.
  |  By Ramya Shah
No IT team sets out to run ten monitoring tools. It happens one purchase at a time. You add a network monitor after one outage, a server monitoring tool after the next, then a log analyzer, then an APM product when the app team gets tired of guessing. Then something breaks, and every one of those tools has an opinion. Each fires its own alerts. None of them agrees on the cause, and the first hour of the incident goes to deciding which screen to believe.
  |  By Poonam Lalani
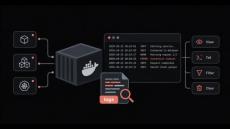
An incident is open and the evidence is scattered. The application logs point to a connection timeout; the load balancer shows nothing unusual, and the container that produced the original error was replaced eighteen minutes ago. Three engineers are logged into three separate hosts running the same search, and the log line that would explain it has already rotated away. That is the moment most teams start shopping for a log file analysis platform.
  |  By Motadata Team
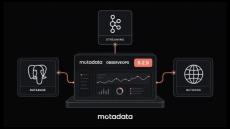
A production service degrades, and one question decides the next hour: is it the server, the network, or a cloud dependency? Each layer usually reports into a separate console, so pinning down the answer can absorb an hour the business would rather not lose. The right infrastructure monitoring tool is what turns that hour into minutes. On paper, most monitoring platforms look identical. Each one promises full-stack visibility and shows a polished dashboard.
  |  By Poonam Lalani
Do you actually know where encryption lives inside your infrastructure? Not the vendor's answer. The full map: every TLS handshake, every signed software update, every VPN tunnel, every certificate your systems trust. That map is where post-quantum cryptography starts to matter. The technology has moved from a research topic into a compliance deadline, and the algorithms protecting your data today were built for a world without quantum computers.
  |  By Poonam Lalani
When an alert lands, does your team already see the full story, or does the work start with pulling scattered data together from one tool after another? For many organizations it's the second one, where the incident itself takes a backseat while analysts hunt across dashboards. The evidence is right there, scattered across platforms that don't share context. Security observability exists to close that gap.
  |  By Ramya Shah
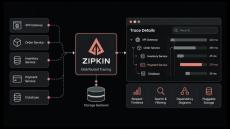
If you run LLM features in production, your most dangerous failures are the ones your monitoring never flags. Your LLM feature passed every test, and the demo went great. Three weeks after launch, a support ticket lands: the chatbot quoted a refund policy that does not exist. The dashboards are all green, and the same prompt answers correctly when you retry it. This is the blind spot LLM observability exists to close. Your existing tools saw the request come back fast with a clean status code.
  |  By Motadata
AI is transforming ITSM beyond co-pilots with autonomous AI agents that can understand, decide, and act. In this webinar, discover how AI agents are reducing manual workloads, accelerating incident resolution, improving service quality, and enabling intelligent service operations. Learn real-world use cases, key implementation strategies, and how organizations can move from reactive support to proactive, AI-driven IT service management. Watch now to explore the future of smarter, faster, and more efficient ITSM.
  |  By Motadata
Quantum computing is reshaping the future of cybersecurity. In this video, learn what a Cryptographic Bill of Materials (CBOM) is, why it matters for post-quantum security, and how it helps organizations identify vulnerable cryptography, prioritize migration, and improve cryptographic visibility. Perfect for security professionals, DevSecOps teams, IT leaders, and compliance teams preparing for the quantum era.
  |  By Motadata
Alert fatigue is one of the biggest reasons critical incidents get missed. In this video, learn what alert fatigue is, why it happens, and how reducing noisy, repetitive notifications helps IT teams respond faster to the alerts that actually matter. Whether you're an IT operations professional, SRE, DevOps engineer, NOC analyst, or IT manager, this video explains alert fatigue in simple terms and shares practical ways to reduce alert noise, prioritize critical issues, and improve incident response.
  |  By Motadata
In this video, you'll learn what a Configuration Item (CI) is, how it forms the foundation of a CMDB, and why connecting CIs helps IT teams understand dependencies, improve visibility, and resolve incidents faster. Discover how CIs transform scattered asset data into a complete, connected view of your IT environment. Whether you're an IT Manager, IT Administrator, Service Desk Analyst, ITSM Professional, Infrastructure Engineer, or IT Operations Leader, this video explains why Configuration Items are essential for effective IT Service Management.
  |  By Motadata
A website can look healthy on your dashboard and still fail when customers try to use it. So how do you catch problems before anyone notices them? In this video, you'll learn what synthetic monitoring is, how it works, and why IT teams use it to detect website and application issues before they impact real users. Discover how automated user journeys help you monitor availability, performance, and critical business transactions 24/7.
  |  By Motadata
A self-service portal is designed to reduce IT support tickets by enabling employees to solve common issues on their own. But if self-service is supposed to improve efficiency, why do so many portals remain unused while help desk queues continue to grow? In this video, you'll learn what a self-service portal is, why many organizations struggle with low adoption, and the three key factors that determine whether your portal actually reduces ticket volume.
  |  By Motadata
In this video, learn what packet loss is, why it happens, and how it silently impacts your network performance even when monitoring dashboards appear healthy. Discover the most common causes of packet loss, how it affects applications like video calls and web services, and why identifying the root cause quickly is critical for maintaining a reliable network.
  |  By Motadata
In this video, learn the difference between SLA, SLO, and SLI and why understanding each one is essential for delivering reliable IT services. Discover how these three service level metrics work together and why tracking the right one helps improve service reliability, customer satisfaction, and operational performance. Whether you're an IT operations professional, SRE, DevOps engineer, or service manager, this video explains SLA, SLO, and SLI in simple terms so you can build measurable goals and realistic service commitments.
  |  By Motadata
In this video, learn what NetFlow is and why it's one of the most effective technologies for understanding network traffic. Discover how NetFlow goes beyond basic bandwidth monitoring by showing who is using your network, what applications are consuming bandwidth, and how traffic patterns change over time. Whether you're a network administrator, IT operations engineer, or infrastructure manager, this video explains NetFlow in simple terms and shows how it helps identify bandwidth hogs, troubleshoot slow networks, and make smarter capacity planning decisions.
  |  By Motadata
In this video, learn what Root Cause Analysis (RCA) is and why it's essential for preventing recurring IT incidents instead of repeatedly fixing the same symptoms. Discover how effective RCA helps IT teams identify the real source of problems, reduce downtime, and improve operational resilience. In this video, you'll learn: Contact Us sales@motadata.com Resources Follow Us on Social Media.
  |  By Motadata
Log management can be seen as both challenge and as an opportunity, the key is to derive intelligence out of it.

Motadata is an IT monitoring and management software that derives business insights by real-time processing, correlation and intelligent visualization of IT network and security information data. It can collect data from multiple sources, in any format, and analyze it for insights. It unifies traditionally separate IT monitoring data from network devices, server instances, virtual machines, cloud deployments, applications and web servers of NOC and log analytics from SOC in a single powerful platform.

With the increasing complexity of today’s heterogeneous networks, it has become imperative for organizations to invest in a robust IT Operations platforms that not only Monitors, Tracks, Analyses but also Resolves issues even before they impact the end users. Motadata offers a unified product suite consisting of Network Monitoring, Bandwidth Monitoring, Log Management, Configuration Management, Asset Management, Helpdesk, Servicedesk & more under one single platform.

Unified Product Suite for IT Operations and Big Data Analytics:

  • IT Service Management Platform: The ITIL Compliant ITSM platform organizes information, automates workflow, eliminates manual/back-end complexities and encourages self-service for maximum productivity and superior user experience for servicedesk or helpdesk.
  • Infrastructure Intelligence Platform: Motadata’s Infrastructure Intelligence Platform (IIP) proactively monitors & optimizes all network devices, servers, and applications across IT infrastructure to manage network for fault and performance for maximum uptime with network monitoring.
  • Data Analytics Platform: Analyse your machine data to identify trends and unleash undiscovered insights from the vast untouched machine data with Elastic search precision with our bandwidth monitoring & log management in data analytics platform.

Complete Visibility Across Your Dynamic Infrastructure with Wholesome Network Monitoring.