Operations | Monitoring | ITSM | DevOps | Cloud

Java

Log4j 2 Configuration Example: Tutorial on How to Use It for Efficient Java Logging

When it comes to troubleshooting application performance, the more information you have the better. Logs combined with metrics and traces give you full visibility into your Java applications. Logging in your Java applications can be achieved in multiple ways – for example, you can just write data to a file, but there are far better ways on how to do that, as we explained in our Java logging tutorial.

Analyze JMX to Better Assess The Health Of Your Java Applications

Java Management Extensions, or JMX, was first added to J2EE, and it has been part of J2SE since the 5.0 release. The JMX API aims to provide a standard for monitoring and managing Java-enabled applications and services. In this article, we will explain the JMX architecture and show you how to pull the metrics that it generates into your Sumo Logic account in order to gain unique insights and a more thorough understanding of the health of your application and services.

The Complete Guide to Java String Replace

One of the most commonly used functionalities for String objects in Java is String replace. With replace(), you can replace an occurrence of a Character or String literal with another Character or String literal. You might use the String.replace() method in situations like: In Java, keep in mind that String objects are immutable, which means the object cannot be changed once it’s created.

Getting Started with Java & OpenTelemetry

It’s easy to get started with Java and Honeycomb using OpenTelemetry. With Honeycomb being a big supporter of the OpenTelemetry initiative, all it takes is a few parameters to get your data in. In this post, I will walk through setting up a demo app with the OpenTelemetry Java agent and show how I was able to get rich details with little work by combining automatic instrumentation from the agent with custom instrumentation in the code.

How to Use Quarkus With Micrometer Metrics to Monitor Microservice Pipeline

At LogicMonitor, we deal primarily with large quantities of time series data. Our backend infrastructure processes billions of metrics, events, and configurations daily. In previous blogs, we discussed our transition from monolith to microservice. We also explained why we chose Quarkus as our microservices framework for our Java-based microservices. In this blog we will cover.

Best Practices for Writing Secure Java Code

Every Java developer should follow coding standards and best practices to develop secure Java code. It is critical your code is not vulnerable to exploits or malicious attacks. In recent times, even big organizations like eBay, the CIA, and the IRS have fallen victim to vulnerabilities in their applications that have been discovered and exploited by attackers. The following guidelines provide a solid foundation for writing secure Java code and applications.

Log4j Tutorial: How to Configure the Logger for Efficient Java Application Logging

Getting visibility into your application is crucial when running your code in production. What do we mean by visibility? Primarily things like application performance via metrics, application health, and availability, its logs should you need to troubleshoot it, or its traces if you need to figure out what makes it slow and how to make it faster. Metrics give you information about the performance of each of the elements of your infrastructure.

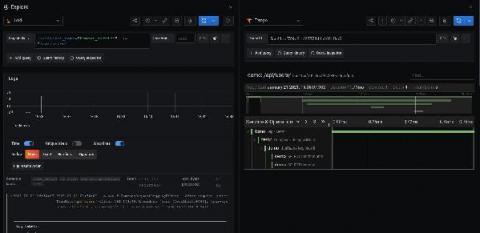
Auto-instrumenting a Java Spring Boot application for traces and logs using OpenTelemetry and Grafana Tempo

Auto-instrumentation is a subject I have not had much experience with. Here at Grafana Labs, we primarily develop in Go, which doesn’t afford such luxuries. However, there is an enormous amount of interest from the community in Java auto-instrumentation, so I set out to determine what was possible using the shiny new OpenTelemetry auto-instrumentation libraries.

Free Java Performance Monitoring and Troubleshooting Tools - Pros and Cons

Software developers are often only concerned about the functionality of their applications. When these applications are deployed in production, scalability and performance issues surface and application developers then have to worry about performance. Many a times, such situations warrant a complete restructuring of the application code, causing significant impact to new rollouts and current users.

Best Practices for Effectively Managing Java Application Performance

Java-based applications are powering many business-critical IT services today and Java technology is widely used as the middleware on which the business logic of multi-tier infrastructures reside. Since the performance of the Java middleware tier has a significant impact on the performance of the business services it supports, monitoring is a necessity and not a choice.